
|
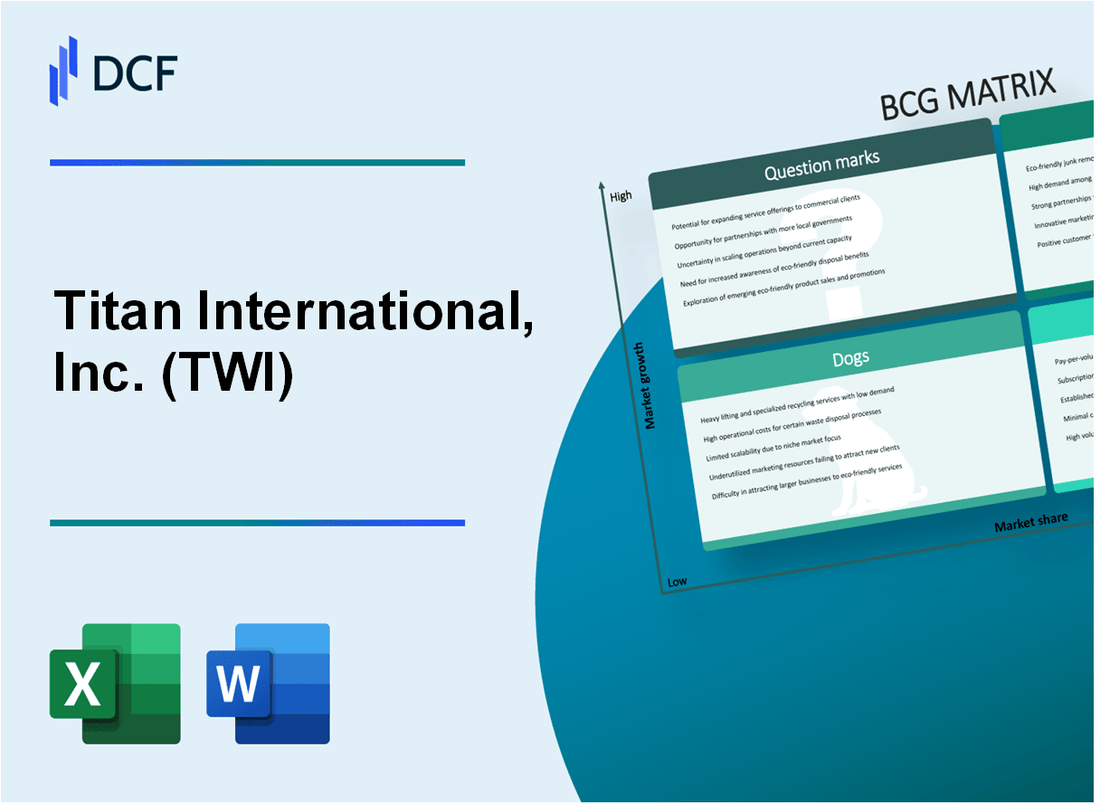
Titan International, Inc. (TWI): BCG Matrix [Dec-2025 Updated] |
Fully Editable: Tailor To Your Needs In Excel Or Sheets
Professional Design: Trusted, Industry-Standard Templates
Investor-Approved Valuation Models
MAC/PC Compatible, Fully Unlocked
No Expertise Is Needed; Easy To Follow
Titan International, Inc. (TWI) Bundle
You're looking at Titan International, Inc. (TWI) right now, and honestly, navigating that cyclical market means every capital dollar has to count. As a long-time observer of heavy equipment suppliers, I can tell you that knowing which parts of TWI are printing cash versus which ones are draining resources is the first step to smart investing. Below, we break down their core businesses-from the high-growth 'Stars' like specialized mining assemblies to the legacy 'Dogs'-using the classic four-quadrant BCG Matrix to map out exactly where TWI's near-term risks and biggest opportunities lie as of late 2025. It's a crucial map for your allocation decisions, defintely.
Background of Titan International, Inc. (TWI)
You're looking at Titan International, Inc. (TWI), a major player in the off-highway equipment supply chain. Honestly, this company is a global manufacturer, specializing in wheels, tires, assemblies, and undercarriage products. They serve the agricultural, earthmoving/construction (EMC), and consumer markets, supplying both original equipment manufacturers (OEMs) and the aftermarket.
Let's look at the most recent numbers we have, which come from the third quarter of 2025, ending September 30, 2025. For that quarter, Titan International posted revenues of $466 million, marking a 4% increase year-over-year. The team managed to expand the gross margin to 15.2%, and Adjusted EBITDA hit $30 million, with free cash flow also coming in strong at $30 million. That's solid execution when you consider the ongoing market dynamics.
Digging into the segments for Q3 2025, the diversity really shows. Year-to-date, the Agricultural (Ag) segment made up 41% of the total revenue, the EMC segment was 31%, and the Consumer segment accounted for 28%. The Ag and EMC segments were the growth drivers in Q3, with Ag revenue up 8% and EMC revenue up 7% compared to the prior year. The Consumer segment, while slightly down year-over-year, saw a strong sequential rebound of nearly 15%.
To give you a clearer picture of the segment health in that quarter, the EMC segment brought in $145 million in sales, and the Consumer segment generated $132 million. Margins also expanded across the board in Q3 versus the prior year: Ag gross margins were 13.4%, EMC was 10.4%, and Consumer was the strongest at 23%. The company's last twelve months' revenue, as of Q3 2025, stands at $1.80B, which is a slight dip of -2.75% compared to the prior twelve-month period.
Looking ahead from that late 2025 vantage point, management provided guidance for the fourth quarter of 2025, anticipating sales between $385 million and $410 million, with Adjusted EBITDA expected to be around $10 million. That guidance reflects the typical seasonal slowdown the company sees, but the midpoint still implies growth versus Q4 of the previous year. Titan International's strategy centers on its global manufacturing footprint and its 'one-stop shop' approach to meet customer needs, especially as they navigate trade policy uncertainty.
Titan International, Inc. (TWI) - BCG Matrix: Stars
You're looking at the business units that are leading the charge for Titan International, Inc. right now. These are the areas showing high market share momentum in growing segments, which is exactly what you want to see in a Star.
The Agricultural (Ag) segment, which includes those high-performance, large-diameter agricultural tires, reported a year-over-year sales growth of 8% in the third quarter of 2025. The Earthmoving/Construction (EMC) segment followed closely with a 7% year-over-year sales increase for the same period. These segments are the engine for current growth.
Here's a snapshot of that recent performance, which you can use when mapping out investment focus:
| Metric (Q3 2025) | Agricultural Segment | Earthmoving/Construction Segment |
| Net Sales Growth (YoY) | 8% | 7% |
| Gross Margin | 13.4% | 10.4% |
| Revenue (Q3 2025) | (Implied from segment performance) | (Implied from segment performance) |
For specialized products, Titan International, Inc. has its patented VPO technology, which lets operators run equipment at 0 PSI under normal conditions. This kind of innovation is what keeps market share high in specialized applications. Also, note that the company is introducing its first Rubber Tracks for light construction applications in Jan 2026, showing continued investment in high-growth product adjacencies.
The overall company financial health in this period supports the investment thesis for Stars. Titan International, Inc. generated consolidated revenues of $466 million in Q3 2025, with an Adjusted EBITDA of $30 million and an equal amount in Free Cash Flow of $30 million for that quarter. This cash generation is key to funding the high-growth needs of these Stars.
The replacement market for premium construction tires in North America is a key driver, evidenced by the segment growth. The company is reinforcing its competitive positioning by bolstering its 'One-Stop Shop' offerings. Consider the following financial metrics that reflect the current state:
- TTM Revenue (as of late 2025): $1.80 Billion USD
- Q3 2025 Consolidated Gross Margin: 15.2%
- Net Debt reduction in Q3 2025: from $391 million to $373 million
- Forecasted Annual Revenue Growth (2025-2027): 4.22%
If you look at the guidance for the immediate future, the company expects Q4 2025 sales between $385 million and $410 million, which suggests a seasonal normalization after the strong Q3 performance. Keeping market share here means continuing to fund these segments until the market growth naturally slows, converting them to Cash Cows.
Titan International, Inc. (TWI) - BCG Matrix: Cash Cows
You're looking at the core engine of Titan International, Inc. (TWI) profitability, the segments that have paid for a lot of the company's recent moves, like the Titan Specialty acquisition. These are the established businesses where Titan holds a strong position, even if the overall market growth has flattened out. We're talking about the North American Agricultural Wheels and Tires segment here, which fits the classic Cash Cow profile: high market share in a mature space.
For the third quarter of 2025, this segment showed some positive momentum, with net sales rising 7.6% year-over-year, reaching a figure that contributed significantly to the total Q3 revenue of $466 million. That's the kind of reliable cash generation we expect from a Cash Cow. Even when the broader market faced headwinds, the segment delivered a gross margin of 15.2% in Q3 2025, showing they can still extract solid profits from established product lines.
The Earthmoving/Construction (EMC) segment also functions in this capacity, providing consistent volume. In Q3 2025, EMC net sales were up 6.6% compared to the prior year period. These legacy products, which include wheels and tires for heavy equipment, require less promotional spending because the market knows the product. The focus here is on efficiency; for instance, the Q2 2025 Adjusted EBITDA was $30 million, and Q3 2025 was also $30 million, demonstrating consistent operating cash generation.
The real proof of the Cash Cow status is the cash flow it supports. In Q3 2025, Titan International generated $30 million in free cash flow, a substantial increase from the $4 million seen in Q2 2025. This cash is vital; it funds the exploration of Question Marks and supports the entire corporate structure. You can see the revenue contribution from these core areas in the table below, keeping in mind that Q1 and Q2 saw sales declines year-over-year before the Q3 rebound.
| Metric | Q1 2025 (Net Sales) | Q2 2025 (Net Sales) | Q3 2025 (Net Sales) |
| Agricultural Segment | $197.7 million | $193.2 million | Increased 7.6% YoY |
| Earthmoving/Construction Segment | N/A | $143.3 million | Increased 6.6% YoY |
The aftermarket business, which involves standard replacement parts for older equipment fleets, is the bedrock of stability here. When OEMs slow down capital expenditure, the aftermarket keeps running because maintenance is non-negotiable. This stream is less sensitive to new equipment cycles. You see this reliability reflected in the strong cash generation even when the top line is pressured; for example, the TTM revenue as of late 2025 was $1.80 Billion USD, but the company is still producing significant operating cash.
Titan International is actively managing these cash cows to maximize their yield. Investments aren't going into flashy promotions but into infrastructure that supports efficiency, like the ongoing integration of the Carlstar acquisition, which bolsters their one-stop-shop aftermarket strategy. The company's focus is on milking these gains passively while maintaining productivity levels above historical cyclical troughs. For instance, the Q2 2025 gross margin of 15% and Q3 2025 gross margin of 15.2% show this operational discipline.
The reliable nature of these segments is what allows Titan International to manage uncertainty, such as the Q4 2025 guidance projecting a dip in sales to between $385 million and $410 million with an Adjusted EBITDA of only ~$10 million, anticipating a seasonal slowdown. Still, the company has long-standing relationships with major OEMs like Deere & Co, Caterpillar Inc., AGCO Corporation, Hitachi Ltd, and Kubota Corporation, ensuring a baseline demand for these established product lines. You should definitely watch how efficiently they manage fixed costs when volumes dip, as that directly impacts the cash flow extracted from these mature assets.
- Core segments generate consistent operating cash flow.
- Q3 2025 Adjusted EBITDA was $30 million.
- Free Cash Flow reached $30 million in Q3 2025.
- Gross margin held at 15% to 15.2% in mid-2025.
- Aftermarket sales provide stability against OEM cycles.
Finance: draft 13-week cash view by Friday.
Titan International, Inc. (TWI) - BCG Matrix: Dogs
You're looking at the parts of Titan International, Inc. (TWI) that are struggling to gain traction in slow-moving markets, which is where we often find the Dogs in the portfolio. These are the areas where market share is tough to win or maintain, and the cash generation is minimal, if not negative.
The Consumer segment, which makes up about 30% of Titan International, Inc.'s total revenue, shows characteristics of a Dog when demand softens. While the segment saw Q1 2025 net sales hit $149.7 million, up from $77.3 million in Q1 2024, this jump is largely attributed to the Titan Specialty acquisition, not necessarily organic growth in the core ATV or lawn and garden areas facing low-margin competition. To be fair, the Consumer gross margin was 19.6% in Q1 2025, improving to 20.4% in Q2 2025 sequentially, but management noted in Q3 2025 that tariffs continued to have some dampening effect on new equipment demand within this area. Honestly, you need to watch the organic growth rate here, separate from acquisition effects.
Consider the impact on your older, less efficient manufacturing assets. When volumes drop, the fixed costs associated with these facilities don't disappear; they just get spread over fewer units. For the three months ended June 30, 2025, lower sales volumes led to reduced fixed cost absorption across the manufacturing facilities in North America and Europe, which directly pressures profitability in those units. You saw this play out in the Earthmoving/Construction segment's gross profit, which was only $17.5 million in Q2 2025, down from $21.3 million in Q2 2024, with the change mainly due to lower volumes and reduced fixed cost leverage. Titan International, Inc. invested $65.6 million in capital expenditures for the year ended December 31, 2024, focusing on enhancement and modernization, suggesting a recognition that older assets need capital to avoid becoming cash traps.
Geographically, Titan International, Inc. has a significant concentration in the US at 51% of revenue, with Europe/CIS at 24% and Latin America at 17% as of July 2025. The weakness in the core Ag and EMC segments was particularly noted in North America and Europe, indicating that in these markets where Titan International, Inc. holds a major share, the low-growth environment is most acutely felt. When you look at the overall picture, the TTM revenue as of September 30, 2025, was $1.80 Billion, but the sequential guidance for Q4 2025 sales is only $385-$410 million, suggesting a significant seasonal or market trough for the end of the year.
The low-end, commodity-grade products are often the first to see pricing pressure when the market turns. While Titan International, Inc. mentioned expanding third-party sourcing to round out its offerings, the overall gross margin for the total company in Q2 2025 was 15.0%, down from 15.1% in Q2 2024, despite favorable price/mix effects in other areas. This indicates that the commodity end, lacking differentiation, struggles to command pricing power when volumes decline. Here's the quick math: Income from operations for Q2 2025 was only $10.2 million on $461 million in sales, a margin of about 2.2%, which is thin coverage for any high operating cost associated with older product lines.
You should track the performance of the segments most exposed to cyclical volume drops:
- Agricultural segment net sales in Q1 2025 were $197.7 million, down from $239.7 million in Q1 2024.
- Earthmoving/Construction segment net sales in Q1 2025 were $143.3 million, down from $165.2 million in Q1 2024.
- Q1 2025 Net Income attributable to common shareholders was a loss of $0.6 million.
- Net debt stood at $411.0 million as of March 31, 2025.
The following table summarizes key financial metrics that reflect the pressure on these lower-performing areas:
| Metric (Period Ended June 30, 2025) | Value (USD) | Comparison Point | Value (USD) |
| Total Revenue (TTM) | $1.78 Billion | Total Revenue (TTM, prior year equivalent) | Implied higher value |
| Income from Operations (Q2 2025) | $10.2 Million | Income from Operations (Q2 2024) | $22.3 Million |
| Gross Margin (Q2 2025) | 15.0% | Gross Margin (Q1 2025) | 14.0% |
| SG&A as % of Net Sales (Q2 2025) | 11.4% | SG&A as % of Net Sales (Q2 2024) | 9.7% |
If onboarding takes 14+ days, churn risk rises, and for these low-margin units, any operational delay is magnified.
Finance: draft 13-week cash view by Friday.
Titan International, Inc. (TWI) - BCG Matrix: Question Marks
You're looking at the areas of Titan International, Inc. (TWI) that are currently burning cash to capture future market share, the classic Question Marks. These are the bets management is placing on new technologies and geographies where the payoff isn't guaranteed yet. Honestly, the financial data shows a company navigating tough macro conditions, but the investments signal where they see the next wave of growth.
The strategy here is clear: pour capital into these areas to quickly move them into the Star quadrant, or cut them loose if they stall. For Titan International, Inc., the focus areas aligning with this profile involve leveraging recent acquisitions and new technology development.
Consider the integration of the Titan Specialty business, which came from the Carlstar Group acquisition. While the overall Consumer segment saw net sales decline by just under 3% year-over-year in Q3 2025, it rebounded nearly 15% sequentially, suggesting high volatility but also high potential growth in specific product lines within that segment, like high-speed trailer and ATV/UTV tires, which are newer to the consolidated portfolio. This segment, while smaller than Agriculture or EMC, represents an area where market penetration for these newer product types is still being established.
The need for significant capital investment is evident in the forward-looking plans. The Turkish plant and the Italian facility are scheduled to be operational in 2026, which represents a major outlay now for capacity expansion in emerging or strategically important markets, fitting the high-investment, high-growth-potential mold.
Here's a quick look at the segment performance that frames the context for these Question Mark investments:
| Segment/Metric | Q3 2025 Revenue (Millions USD) | YoY Net Sales Change | Q3 2025 Gross Margin (%) |
| Agricultural | $188.7 | Increase | 13.4% |
| Earthmoving/Construction (EMC) | $145.4 | Up 6% | 10.4% |
| Consumer (Including Specialty) | $132 | Decline (Slightly) | 23% |
The development of entirely new tire/wheel solutions is a direct play into the Question Mark category. These are products where adoption rates are uncertain but the potential market size in niche, high-tech applications could be substantial. Management is actively developing these solutions, which consume R&D cash without guaranteed near-term returns.
The specific initiatives that you should track as potential Question Marks include:
- Development of run-flat tires for outdoor power equipment.
- New low sidewall products and deep-drop wheels for agriculture.
- Flow-forming technology implementation at the Quincy, Ill. wheel factory.
- Expansion of Goodyear licensing rights into lawn and garden and golf tires.
The commitment to future capacity, signaled by the planned 2026 plant openings, requires cash now. For instance, the company reduced its net debt to $373 million from $391 million in the prior quarter, achieving leverage of 3.7x, but this debt management occurs while simultaneously funding these growth bets. The Q4 2025 Adjusted EBITDA guidance of approximately $10 million against Q3's $30 million suggests cash consumption or lower returns are expected in the immediate term as the business cycles down seasonally, putting pressure on these Question Marks to prove their worth.
The push into electrification and autonomous components, while not quantified with specific revenue figures yet, is a necessary strategic move in the off-highway space. This R&D spending is a classic cash drain associated with Question Marks, aiming to secure a foothold in a high-growth future market where current market share is effectively zero.
Finance: draft the Q4 2025 cash flow projection incorporating the expected capital deployment for the 2026 plant startups by Monday.
Disclaimer
All information, articles, and product details provided on this website are for general informational and educational purposes only. We do not claim any ownership over, nor do we intend to infringe upon, any trademarks, copyrights, logos, brand names, or other intellectual property mentioned or depicted on this site. Such intellectual property remains the property of its respective owners, and any references here are made solely for identification or informational purposes, without implying any affiliation, endorsement, or partnership.
We make no representations or warranties, express or implied, regarding the accuracy, completeness, or suitability of any content or products presented. Nothing on this website should be construed as legal, tax, investment, financial, medical, or other professional advice. In addition, no part of this site—including articles or product references—constitutes a solicitation, recommendation, endorsement, advertisement, or offer to buy or sell any securities, franchises, or other financial instruments, particularly in jurisdictions where such activity would be unlawful.
All content is of a general nature and may not address the specific circumstances of any individual or entity. It is not a substitute for professional advice or services. Any actions you take based on the information provided here are strictly at your own risk. You accept full responsibility for any decisions or outcomes arising from your use of this website and agree to release us from any liability in connection with your use of, or reliance upon, the content or products found herein.