
|
Unifi, Inc. (UFI) DCF Valuation |
Fully Editable: Tailor To Your Needs In Excel Or Sheets
Professional Design: Trusted, Industry-Standard Templates
Investor-Approved Valuation Models
MAC/PC Compatible, Fully Unlocked
No Expertise Is Needed; Easy To Follow
Unifi, Inc. (UFI) Bundle
Discover the true value of Unifi, Inc. (UFI) with our professional-grade DCF Calculator! Adjust essential assumptions, explore various scenarios, and evaluate how changes affect Unifi, Inc. (UFI) valuation – all within a single Excel template.
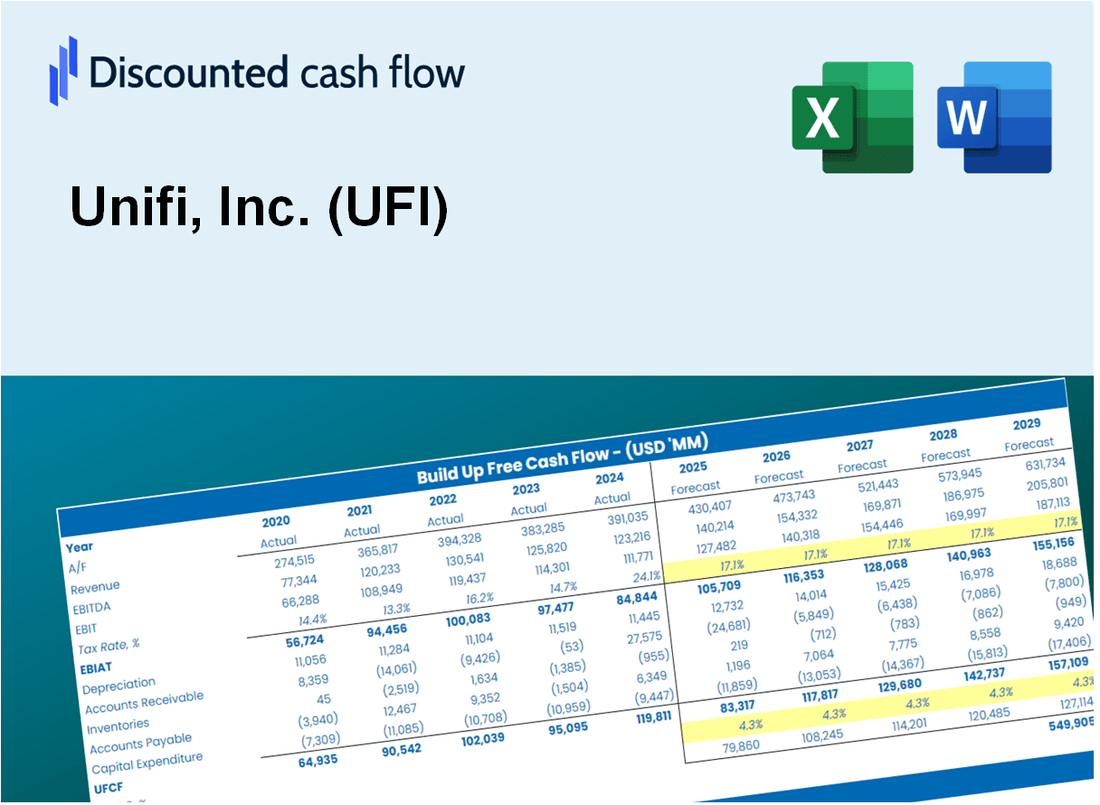
Discounted Cash Flow (DCF) - (USD MM)
| Year | AY1 2021 |
AY2 2022 |
AY3 2023 |
AY4 2024 |
AY5 2025 |
FY1 2026 |
FY2 2027 |
FY3 2028 |
FY4 2029 |
FY5 2030 |
|---|---|---|---|---|---|---|---|---|---|---|
| Revenue | 667.6 | 815.8 | 623.5 | 582.2 | 571.3 | 557.3 | 543.5 | 530.1 | 517.0 | 504.3 |
| Revenue Growth, % | 0 | 22.19 | -23.56 | -6.63 | -1.87 | -2.47 | -2.47 | -2.47 | -2.47 | -2.47 |
| EBITDA | 76.3 | 55.9 | -10.8 | -8.0 | 16.2 | 20.1 | 19.6 | 19.1 | 18.6 | 18.2 |
| EBITDA, % | 11.43 | 6.85 | -1.74 | -1.38 | 2.83 | 3.6 | 3.6 | 3.6 | 3.6 | 3.6 |
| Depreciation | 25.3 | 26.0 | 27.0 | 27.7 | 25.3 | 22.8 | 22.3 | 21.7 | 21.2 | 20.7 |
| Depreciation, % | 3.79 | 3.19 | 4.33 | 4.75 | 4.43 | 4.1 | 4.1 | 4.1 | 4.1 | 4.1 |
| EBIT | 51.0 | 29.9 | -37.9 | -35.7 | -9.1 | -2.8 | -2.7 | -2.6 | -2.6 | -2.5 |
| EBIT, % | 7.64 | 3.67 | -6.07 | -6.13 | -1.59 | -0.49717 | -0.49717 | -0.49717 | -0.49717 | -0.49717 |
| Total Cash | 78.3 | 53.3 | 47.0 | 26.8 | 22.7 | 38.3 | 37.3 | 36.4 | 35.5 | 34.7 |
| Total Cash, percent | .0 | .0 | .0 | .0 | .0 | .0 | .0 | .0 | .0 | .0 |
| Account Receivables | 100.0 | 115.8 | 83.5 | 82.4 | 80.8 | 79.0 | 77.0 | 75.1 | 73.3 | 71.5 |
| Account Receivables, % | 14.99 | 14.19 | 13.4 | 14.15 | 14.14 | 14.17 | 14.17 | 14.17 | 14.17 | 14.17 |
| Inventories | 141.2 | 173.3 | 150.8 | 131.2 | 122.9 | 123.3 | 120.3 | 117.3 | 114.4 | 111.6 |
| Inventories, % | 21.15 | 21.24 | 24.19 | 22.53 | 21.52 | 22.13 | 22.13 | 22.13 | 22.13 | 22.13 |
| Accounts Payable | 54.3 | 73.5 | 44.5 | 43.6 | 37.5 | 42.7 | 41.7 | 40.6 | 39.6 | 38.7 |
| Accounts Payable, % | 8.13 | 9.02 | 7.13 | 7.49 | 6.56 | 7.66 | 7.66 | 7.66 | 7.66 | 7.66 |
| Capital Expenditure | -24.8 | -39.6 | -36.4 | -11.2 | -10.5 | -20.3 | -19.8 | -19.3 | -18.8 | -18.3 |
| Capital Expenditure, % | -3.71 | -4.86 | -5.84 | -1.92 | -1.84 | -3.63 | -3.63 | -3.63 | -3.63 | -3.63 |
| Tax Rate, % | -9.23 | -9.23 | -9.23 | -9.23 | -9.23 | -9.23 | -9.23 | -9.23 | -9.23 | -9.23 |
| EBITAT | 32.0 | 16.9 | -38.6 | -37.1 | -9.9 | -2.3 | -2.3 | -2.2 | -2.2 | -2.1 |
| Depreciation | ||||||||||
| Changes in Account Receivables | ||||||||||
| Changes in Inventories | ||||||||||
| Changes in Accounts Payable | ||||||||||
| Capital Expenditure | ||||||||||
| UFCF | -154.5 | -25.2 | -22.4 | -.7 | 8.5 | 7.0 | 4.2 | 4.1 | 4.0 | 3.9 |
| WACC, % | 5.71 | 5.42 | 7.5 | 7.5 | 7.5 | 6.73 | 6.73 | 6.73 | 6.73 | 6.73 |
| PV UFCF | ||||||||||
| SUM PV UFCF | 19.4 | |||||||||
| Long Term Growth Rate, % | 2.00 | |||||||||
| Free cash flow (T + 1) | 4 | |||||||||
| Terminal Value | 84 | |||||||||
| Present Terminal Value | 61 | |||||||||
| Enterprise Value | 80 | |||||||||
| Net Debt | 93 | |||||||||
| Equity Value | -13 | |||||||||
| Diluted Shares Outstanding, MM | 18 | |||||||||
| Equity Value Per Share | -0.73 |
What You Will Get
- Editable Forecast Inputs: Effortlessly adjust assumptions (growth %, margins, WACC) to explore various scenarios.
- Real-World Data: Unifi, Inc.’s (UFI) financial data pre-loaded to facilitate your analysis.
- Automatic DCF Outputs: The template computes Net Present Value (NPV) and intrinsic value automatically.
- Customizable and Professional: A sophisticated Excel model tailored to meet your valuation requirements.
- Built for Analysts and Investors: Perfect for evaluating projections, confirming strategies, and enhancing efficiency.
Key Features
- Comprehensive UFI Data: Pre-loaded with Unifi’s historical performance metrics and future projections.
- Customizable Assumptions: Modify revenue growth rates, operating margins, discount rates, tax assumptions, and capital expenditures.
- Interactive Valuation Framework: Automatic recalculations of Net Present Value (NPV) and intrinsic value based on your inputs.
- Multiple Scenario Analysis: Develop various forecasting scenarios to explore different valuation possibilities.
- Intuitive User Interface: Designed for ease of use, catering to both seasoned professionals and newcomers.
How It Works
- Step 1: Download the Excel file.
- Step 2: Review Unifi, Inc.'s (UFI) pre-filled financial data and forecasts.
- Step 3: Modify key inputs such as revenue growth, WACC, and tax rates (highlighted cells).
- Step 4: Observe the DCF model update in real-time as you adjust assumptions.
- Step 5: Analyze the outputs and utilize the results for your investment decisions.
Why Choose This Calculator for Unifi, Inc. (UFI)?
- All-in-One Solution: Integrates DCF, WACC, and financial ratio analyses tailored for Unifi, Inc. (UFI).
- Flexible Inputs: Modify yellow-highlighted fields to explore different financial scenarios.
- In-Depth Analysis: Automatically computes Unifi, Inc. (UFI)’s intrinsic value and Net Present Value.
- Preloaded Information: Access historical and projected data for reliable analysis.
- High-Quality Standards: Perfect for financial analysts, investors, and business consultants focusing on Unifi, Inc. (UFI).
Who Should Use This Product?
- Investors: Accurately assess Unifi, Inc.’s (UFI) fair value prior to making investment choices.
- CFOs: Utilize a professional-grade DCF model for financial reporting and analysis specific to Unifi, Inc. (UFI).
- Consultants: Easily customize the template for valuation reports tailored to Unifi, Inc. (UFI) clients.
- Entrepreneurs: Discover insights into financial modeling practices employed by leading companies like Unifi, Inc. (UFI).
- Educators: Implement it as a teaching resource to illustrate valuation techniques relevant to Unifi, Inc. (UFI).
What the Template Contains
- Pre-Filled DCF Model: Unifi, Inc.'s (UFI) financial data preloaded for immediate use.
- WACC Calculator: Detailed calculations for Weighted Average Cost of Capital.
- Financial Ratios: Evaluate Unifi, Inc.'s (UFI) profitability, leverage, and efficiency.
- Editable Inputs: Change assumptions such as growth, margins, and CAPEX to fit your scenarios.
- Financial Statements: Annual and quarterly reports to support detailed analysis.
- Interactive Dashboard: Easily visualize key valuation metrics and results.
Disclaimer
All information, articles, and product details provided on this website are for general informational and educational purposes only. We do not claim any ownership over, nor do we intend to infringe upon, any trademarks, copyrights, logos, brand names, or other intellectual property mentioned or depicted on this site. Such intellectual property remains the property of its respective owners, and any references here are made solely for identification or informational purposes, without implying any affiliation, endorsement, or partnership.
We make no representations or warranties, express or implied, regarding the accuracy, completeness, or suitability of any content or products presented. Nothing on this website should be construed as legal, tax, investment, financial, medical, or other professional advice. In addition, no part of this site—including articles or product references—constitutes a solicitation, recommendation, endorsement, advertisement, or offer to buy or sell any securities, franchises, or other financial instruments, particularly in jurisdictions where such activity would be unlawful.
All content is of a general nature and may not address the specific circumstances of any individual or entity. It is not a substitute for professional advice or services. Any actions you take based on the information provided here are strictly at your own risk. You accept full responsibility for any decisions or outcomes arising from your use of this website and agree to release us from any liability in connection with your use of, or reliance upon, the content or products found herein.