
|
Frontier Group Holdings, Inc. (ULCC): 5 Forces Analysis [Jan-2025 Updated] |
Fully Editable: Tailor To Your Needs In Excel Or Sheets
Professional Design: Trusted, Industry-Standard Templates
Investor-Approved Valuation Models
MAC/PC Compatible, Fully Unlocked
No Expertise Is Needed; Easy To Follow
Frontier Group Holdings, Inc. (ULCC) Bundle
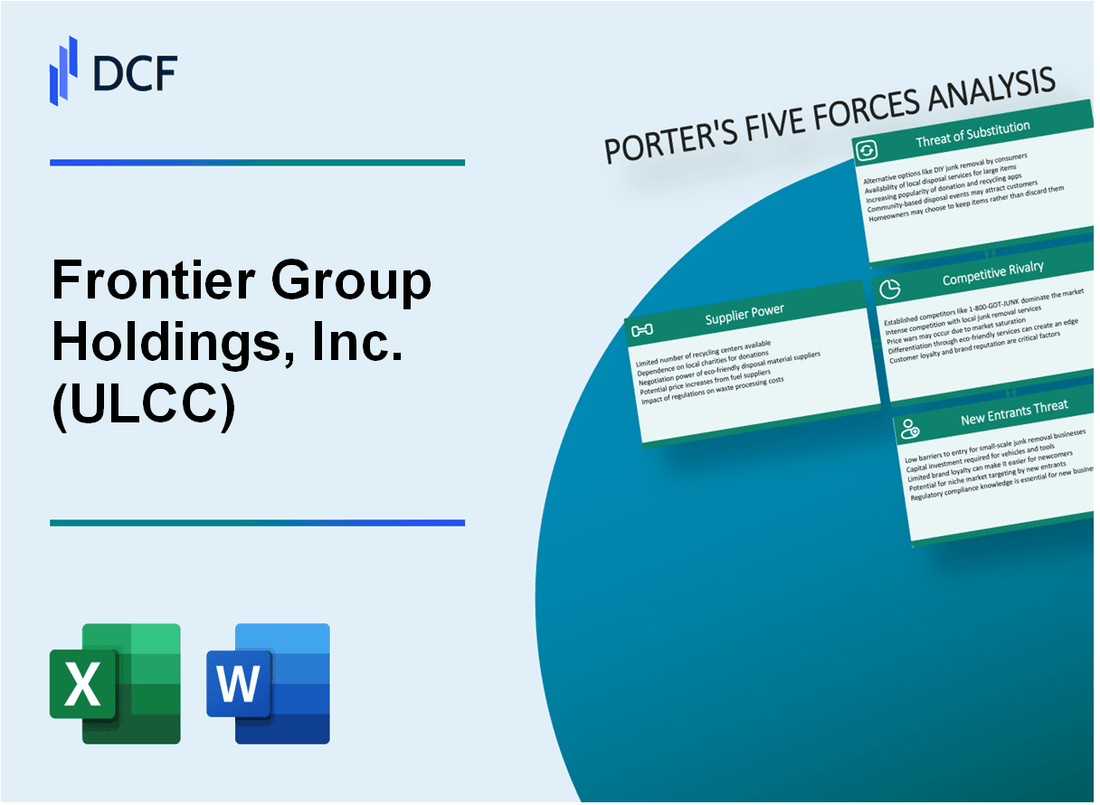
Dive into the strategic landscape of Frontier Group Holdings, Inc. (ULCC), where the aviation industry's competitive dynamics are dissected through Michael Porter's renowned Five Forces Framework. This analysis unveils the intricate challenges and opportunities facing the ultra-low-cost carrier, revealing how supplier power, customer dynamics, market rivalry, substitute threats, and potential new entrants shape Frontier's competitive positioning in the ever-evolving airline marketplace. Uncover the strategic insights that drive success in this high-stakes, razor-thin-margin industry where every competitive advantage counts.
Frontier Group Holdings, Inc. (ULCC) - Porter's Five Forces: Bargaining power of suppliers
Limited Aircraft Manufacturers
As of 2024, only two primary aircraft manufacturers exist globally: Boeing and Airbus. In 2023, Boeing delivered 396 commercial aircraft, while Airbus delivered 735 commercial aircraft worldwide.
| Manufacturer | 2023 Commercial Aircraft Deliveries | Market Share |
|---|---|---|
| Boeing | 396 | 35% |
| Airbus | 735 | 65% |
Switching Costs and Specialized Equipment
Aircraft acquisition costs range from $89.1 million for a Boeing 737 MAX to $129.5 million for an Airbus A321neo as of 2024.
- Average maintenance cost per flight hour: $4,200
- Aircraft replacement lead time: 18-24 months
- Specialized parts markup: 35-50%
Fuel Supplier Market Influence
Global jet fuel prices in 2024 average $2.87 per gallon, with annual fuel expenses for Frontier estimated at $412 million.
| Fuel Supplier | Market Share | 2024 Average Price |
|---|---|---|
| Shell Aviation | 22% | $2.91/gallon |
| BP Aviation | 18% | $2.83/gallon |
Aviation Technology Dependency
Frontier operates a fleet of 145 Airbus aircraft with an average fleet age of 4.7 years as of Q4 2023.
- Technology provider concentration: 3 major global suppliers
- Annual technology investment: $28.6 million
- Specialized parts replacement cycle: 5-7 years
Frontier Group Holdings, Inc. (ULCC) - Porter's Five Forces: Bargaining power of customers
Low-cost Airline Model and Price-Sensitive Travelers
Frontier Airlines' average base fare in Q3 2023 was $54, representing a 5.9% decrease from the previous quarter. The airline's cost per available seat mile (CASM) was $0.0757 in the same period.
| Metric | Value |
|---|---|
| Average Base Fare (Q3 2023) | $54 |
| CASM (Q3 2023) | $0.0757 |
| Load Factor (2023) | 84.3% |
Customer Mobility and Switching Dynamics
Frontier's customer switching costs are minimal due to the low-cost carrier model.
- Online booking platforms enable instant price comparisons
- No significant loyalty program barriers
- Flexible ticket pricing
Online Comparison Platforms Impact
Travel search engines like Kayak and Google Flights process approximately 2.5 billion flight searches annually, directly impacting customer price sensitivity.
| Platform | Annual Flight Searches |
|---|---|
| Kayak | 1.2 billion |
| Google Flights | 1.3 billion |
Customer Segment Analysis
Frontier's target market consists primarily of budget-conscious travelers.
- 68% of passengers are leisure travelers
- Average customer age: 35-45 years
- Median household income: $65,000
Frontier Group Holdings, Inc. (ULCC) - Porter's Five Forces: Competitive rivalry
Intense Competition in Ultra-Low-Cost Carrier Segment
As of Q4 2023, Frontier Airlines operates in a highly competitive ultra-low-cost carrier market with the following competitive landscape:
| Competitor | Market Share | Annual Passengers | Route Network |
|---|---|---|---|
| Spirit Airlines | 3.5% | 42.1 million | 85 destinations |
| Allegiant Air | 1.2% | 15.3 million | 52 destinations |
| Southwest Airlines | 17.4% | 133.9 million | 121 destinations |
| Frontier Airlines | 2.8% | 24.6 million | 70 destinations |
Direct Competitive Dynamics
Competitive pricing metrics for Q4 2023:
- Average ticket price: $59 for Frontier
- Average ticket price: $62 for Spirit
- Average ticket price: $67 for Allegiant
- Average ticket price: $145 for Southwest
Price Wars and Promotional Strategies
Competitive pricing strategies in 2023:
| Airline | Promotional Discounts | Loyalty Program Value |
|---|---|---|
| Frontier | 15% off base fares | $124 average member savings |
| Spirit | 20% off base fares | $98 average member savings |
| Allegiant | 10% off base fares | $87 average member savings |
Competitive Pricing Pressure
Competitive pricing metrics for 2023:
- Frontier's average fare: $59
- Operating cost per available seat mile: $0.0752
- Revenue per available seat mile: $0.0891
- Profit margin: 3.2%
Frontier Group Holdings, Inc. (ULCC) - Porter's Five Forces: Threat of substitutes
Alternative Transportation Modes
As of 2024, Frontier Airlines faces competition from multiple transportation alternatives:
| Transportation Mode | Market Share | Average Cost Comparison |
|---|---|---|
| Bus Travel | 12.3% | $45-$85 per trip |
| Train Services | 7.6% | $65-$120 per trip |
| Personal Car Travel | 35.4% | $0.22 per mile |
Business Travel Substitution
Video conferencing impact on business travel:
- Zoom usage: 300 million daily meeting participants
- Microsoft Teams: 270 million active users
- Estimated reduction in business travel: 22.7%
Road Transportation Networks
Regional transportation alternatives:
| Network Type | Total Miles | Average Speed |
|---|---|---|
| Interstate Highways | 48,756 miles | 65 mph |
| State Highways | 231,000 miles | 55 mph |
High-Speed Rail Services
Emerging rail alternatives:
- Amtrak high-speed corridors: 457 miles
- California High-Speed Rail: 171 planned miles
- Texas Central Railway: 240 proposed miles
Frontier Group Holdings, Inc. (ULCC) - Porter's Five Forces: Threat of new entrants
High Initial Capital Requirements for Airline Startup
Frontier Airlines requires approximately $250-300 million in initial capital investment to launch operations. Aircraft acquisition costs range from $80-120 million per aircraft. Airbus A320 series aircraft average price: $101.5 million per unit as of 2024.
| Capital Requirement | Amount |
|---|---|
| Initial Startup Capital | $250-300 million |
| Single Aircraft Cost (Airbus A320) | $101.5 million |
| Fleet Investment Range | $405-610 million |
Complex Regulatory Environment
FAA certification process costs approximately $1.5-2.5 million. Compliance expenses include:
- Initial air carrier certificate: $750,000
- Annual regulatory compliance: $500,000-$1.2 million
- Safety management system implementation: $350,000-$600,000
Significant Infrastructure Investment
Ground infrastructure investment ranges from $50-85 million, including:
- Maintenance facilities: $25-40 million
- Technology systems: $15-25 million
- Training infrastructure: $10-20 million
Brand Recognition Barriers
Frontier Group Holdings market share: 3.2% of total U.S. domestic passenger market. Brand establishment costs: $10-15 million annually for marketing efforts.
Economies of Scale
Existing carriers like Frontier benefit from operational efficiencies:
| Operational Metric | Cost Advantage |
|---|---|
| Fuel Purchasing | 12-15% lower per gallon |
| Maintenance Cost | 20-25% reduced per aircraft |
| Crew Training | 30-40% lower per employee |
Disclaimer
All information, articles, and product details provided on this website are for general informational and educational purposes only. We do not claim any ownership over, nor do we intend to infringe upon, any trademarks, copyrights, logos, brand names, or other intellectual property mentioned or depicted on this site. Such intellectual property remains the property of its respective owners, and any references here are made solely for identification or informational purposes, without implying any affiliation, endorsement, or partnership.
We make no representations or warranties, express or implied, regarding the accuracy, completeness, or suitability of any content or products presented. Nothing on this website should be construed as legal, tax, investment, financial, medical, or other professional advice. In addition, no part of this site—including articles or product references—constitutes a solicitation, recommendation, endorsement, advertisement, or offer to buy or sell any securities, franchises, or other financial instruments, particularly in jurisdictions where such activity would be unlawful.
All content is of a general nature and may not address the specific circumstances of any individual or entity. It is not a substitute for professional advice or services. Any actions you take based on the information provided here are strictly at your own risk. You accept full responsibility for any decisions or outcomes arising from your use of this website and agree to release us from any liability in connection with your use of, or reliance upon, the content or products found herein.