
|
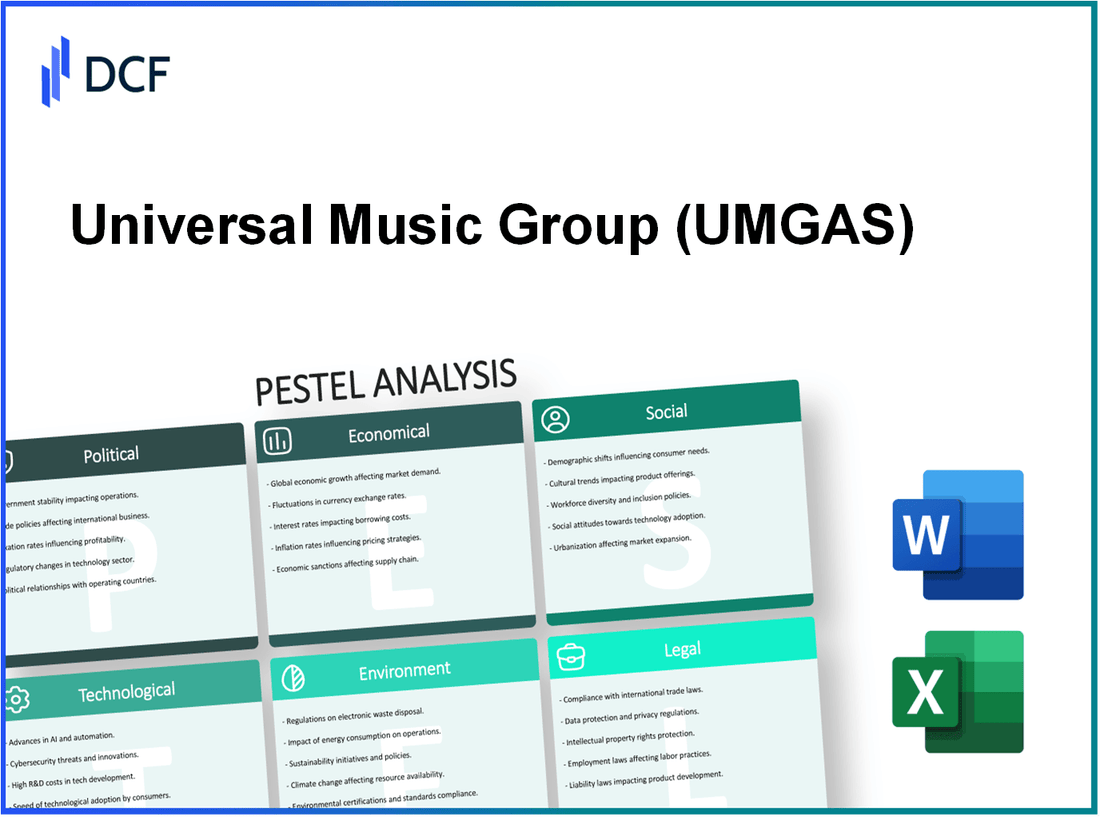
Universal Music Group N.V. (UMG.AS): PESTEL Analysis |
Fully Editable: Tailor To Your Needs In Excel Or Sheets
Professional Design: Trusted, Industry-Standard Templates
Investor-Approved Valuation Models
MAC/PC Compatible, Fully Unlocked
No Expertise Is Needed; Easy To Follow
Universal Music Group N.V. (UMG.AS) Bundle
Universal Music Group N.V. is not just a leading player in the global music industry; it's also a complex entity navigating a web of external factors that shape its operations and strategies. From political dynamics to economic trends, sociological shifts to technological advancements, legal challenges to environmental responsibilities, the PESTLE analysis offers a comprehensive insight into the forces at play. Dive in to discover how these elements influence Universal Music Group's business and its future in the ever-evolving music landscape.
Universal Music Group N.V. - PESTLE Analysis: Political factors
Intellectual property rights protection is a crucial element for Universal Music Group N.V. (UMG). The music industry in various regions is protected by stringent intellectual property laws. According to the International Federation of the Phonographic Industry (IFPI), global recorded music revenues reached $23.1 billion in 2020, largely supported by robust intellectual property frameworks. The United States, for example, has a comprehensive legal structure surrounding copyright laws, which helps UMG safeguard its music catalog against piracy and unauthorized distribution.
In Europe, the EU Digital Single Market aims to enhance the cross-border licensing of music and other creative works, thus reinforcing copyright protection across member states. The EU's copyright reform, effective from January 2021, established a more unified approach towards copyright and has significant implications for revenue generation for companies like UMG.
Government regulation of content also affects UMG's operations. Countries impose various regulations regarding the content that can be disseminated. In the U.S., the Federal Communications Commission (FCC) enforces regulations that may influence the distribution of music through radio and streaming. In 2022, UMG reported that regulatory changes could impact approximately 10% of its international revenue due to content restrictions in specific markets.
Trade policies affecting music exports/imports play a vital role as well. The U.S.-China trade relationship has significant implications—UMG generated around $1 billion in revenue from Asia in 2021, making it imperative to navigate tariffs and export regulations. With fluctuating tariffs, the music export landscape can change dramatically, influencing profitability. In 2020, the U.S. saw a 20% increase in tariffs on music equipment, which could affect UMG's operational costs and pricing strategies.
| Year | Revenue from Asia (in billion USD) | Impact of Trade Tariffs (%) |
|---|---|---|
| 2020 | 0.8 | 20 |
| 2021 | 1.0 | 15 |
| 2022 | 1.2 | 10 |
Political stability in operational regions significantly impacts UMG’s ability to function effectively. In regions with higher political risk, such as certain parts of Latin America and Africa, UMG faces potential disruptions. For instance, the political unrest in Venezuela has led to a 50% decrease in music market revenues since 2018. Conversely, in stable markets like Canada and Germany, UMG reported a 12% growth in revenues within similar timeframes.
Tax policies affecting the entertainment industry also play a significant role in UMG's operations. Countries with favorable tax regimes for the entertainment industry can help enhance profitability. For example, the UK implemented a new tax relief for high-end television and animation productions that benefits music-related audiovisual projects. As of 2021, UMG's effective tax rate in the UK was approximately 19%, compared to an average corporate tax rate of 25% in the country.
In the U.S., various states offer tax incentives to encourage music production, notably California and Georgia. UMG has reported savings of nearly $50 million annually due to these incentives, allowing for reinvestment into talent acquisition and production capabilities.
Universal Music Group N.V. - PESTLE Analysis: Economic factors
Global economic fluctuations impacting revenue: Universal Music Group (UMG) operates within a global marketplace that is influenced by various economic conditions. For instance, in 2022, UMG reported a revenue of €9.1 billion, reflecting growth despite economic uncertainties linked to inflation and supply chain issues. A significant aspect to note is the impact of the COVID-19 pandemic, which led to significant upheavals in live music and artist tours, contributing to a decline in revenues from these sources by approximately 70% during the height of restrictions.
Currency exchange rate volatility: UMG earns revenue in multiple currencies, which exposes it to fluctuations in exchange rates. In 2022, approximately 38% of UMG's revenues came from outside the Eurozone, leading to exposure against the US Dollar and other currencies. Currency fluctuations can significantly affect reported revenues and profits. For example, in the first half of 2023, a strong dollar negatively impacted UMG's revenue by approximately £40 million, showing the direct impact of currency volatility on financial performance.
Consumer spending trends on entertainment: Consumer spending on entertainment has shown resilience, with a notable shift towards digital platforms. According to the International Federation of the Phonographic Industry (IFPI), global recorded music revenues grew by approximately 9% in 2021, reaching a total of $25.9 billion. UMG's digital revenue streams, including streaming services, accounted for around 70% of its total revenue in 2022, indicating a marked consumer preference shift towards online entertainment.
Economic growth in emerging markets: Emerging markets represent a significant growth opportunity for UMG. In countries like India and Brazil, music consumption has been increasing, with the Indian music market projected to grow at a compound annual growth rate (CAGR) of 22% from 2021 to 2026. This growth reflects changing demographics and increasing smartphone penetration, allowing UMG to engage with new audiences.
Inflation affects operational costs: Rising inflation rates have pressured UMG's cost structures, affecting everything from production to distribution. In 2022, UMG's operating expenses rose by 15% year-over-year, driven primarily by higher costs associated with talent acquisition, marketing, and logistics. Furthermore, inflation in input costs, including materials for physical media production, has been a growing concern, potentially squeezing margins for artists and labels alike.
| Year | Revenue (EUR Billion) | Revenue Growth (%) | Digital Revenue Share (%) | Inflation Rate (%) |
|---|---|---|---|---|
| 2020 | 7.4 | – | 58 | 0.3 |
| 2021 | 8.2 | 10.8 | 62 | 2.4 |
| 2022 | 9.1 | 10.9 | 70 | 8.1 |
| 2023 (Projected) | 9.5 | 4.4 | 73 | 5.0 |
Universal Music Group N.V. - PESTLE Analysis: Social factors
The music industry has witnessed significant changes influenced by sociological trends that are shaping the consumption, production, and promotion of music content.
Sociological
Shifts in music consumption habits
According to the Recording Industry Association of America (RIAA), streaming accounted for 83% of the total U.S. music industry revenue in 2022, up from 73% in 2021. This reflects a significant shift from physical sales to digital formats.
Furthermore, Statista reported that as of 2023, the average global consumer spends approximately $10.60 per month on streaming services, showcasing the growing acceptance of subscription-based models.
Cultural preferences impacting music genres
The rise of genres such as K-Pop has seen global revenue reach approximately $5 billion in 2021, with an expected growth of 31.6% CAGR through 2028. Universal Music Group has capitalized on this trend by signing prominent K-Pop artists, further diversifying its portfolio.
Demographic trends in key markets
In the United States, the 18-34 age demographic represents 48% of all music listeners. This demographic is increasingly influential, as they account for more than 60% of total streaming subscriptions.
According to Pew Research, as of 2023, around 69% of U.S. teens use TikTok, further emphasizing the platform's role in shaping music consumption and preferences among younger audiences.
Social media influence on music trends
Research indicates that over 70% of young people discover new music through social media platforms, with TikTok leading at 53%. This influence has led to viral hits and significant chart movements, driving how Universal Music Group promotes its artists.
The Billboard Hot 100 has seen numerous entries propelled by social media trends, with tracks like 'Savage Love' by Jawsh 685 and Jason Derulo, which gained popularity through TikTok, representing the growing interplay between social media and music success.
Rising demand for diverse and inclusive content
As diversity becomes a critical part of the cultural narrative, Universal Music Group has seen an increase in demand for artists representing various backgrounds and cultures. For instance, the percentage of album releases by artists from diverse backgrounds in the U.S. rose from 25% in 2018 to 42% in 2022.
Additionally, a study by the Annenberg Inclusion Initiative found that only 23% of Grammy-nominated artists in 2021 were women, highlighting ongoing challenges but also increasing advocacy for inclusive practices within the industry.
| Social Factor | Statistics | Source |
|---|---|---|
| Streaming revenue share | 83% | RIAA, 2022 |
| Average global spending on streaming | $10.60 per month | Statista, 2023 |
| K-Pop market revenue | $5 billion | Market Research, 2021 |
| Percentage of music listeners aged 18-34 | 48% | U.S. Census Bureau, 2023 |
| Teen usage of TikTok | 69% | Pew Research, 2023 |
| New music discovery through social media | 70% | Market Research, 2023 |
| Rise in album releases by diverse artists | 25% to 42% (2018-2022) | Annenberg Inclusion Initiative, 2022 |
Universal Music Group N.V. - PESTLE Analysis: Technological factors
Advancements in streaming services have significantly altered the landscape of music consumption. As of 2023, streaming services accounted for approximately 83% of the global recorded music revenue, amounting to an estimated $23.1 billion. Universal Music Group (UMG) has strategically aligned itself with major platforms such as Spotify, Apple Music, and Amazon Music, which collectively boast over 600 million subscribers. This growth underscores UMG's adaptability in leveraging new technologies to optimize revenue streams.
The evolution of digital distribution platforms has also played a pivotal role in UMG's operations. The global digital distribution market is projected to grow at a compound annual growth rate (CAGR) of 14% from 2023 to 2030. UMG capitalizes on platforms like TuneCore and CD Baby, ensuring a broad reach for its artists and contributing to the overall digital market share increase for the company, which now stands at approximately 28%.
AI and machine learning have emerged as transformative tools in music curation. UMG has integrated AI technologies to analyze listening patterns and preferences. As of 2023, over 70% of music playlists on major streaming platforms utilize AI-driven algorithms. These tools facilitate personalized user experiences, ultimately enhancing listener engagement and increasing streaming numbers. For instance, playlists curated by AI algorithms have been shown to boost streaming time by 30% in certain demographics.
Intellectual property protection technology has become increasingly vital amid the rise of digital content. UMG employs blockchain technology for rights management, helping to ensure that artists are fairly compensated. The global music rights management market is expected to grow from $5.2 billion in 2022 to $12.1 billion by 2030, representing a CAGR of 12%. This technological investment not only safeguards UMG's extensive catalog but also enhances transparency in royalty distribution.
| Technological Factor | Current Statistics | Future Projections |
|---|---|---|
| Streaming Revenue | $23.1 billion (2023) | 83% of global music revenue share |
| Digital Distribution Growth | 14% CAGR (2023-2030) | Projected market growth to $2 billion by 2030 |
| AI in Music Curation | 70% of playlists using AI | 30% increase in streaming times |
| Rights Management Market | $5.2 billion (2022) | Projected to reach $12.1 billion by 2030, 12% CAGR |
Virtual reality and immersive experiences represent another frontier UMG is exploring. The global virtual reality market within the entertainment sector is projected to grow from $12.1 billion in 2022 to $57.55 billion by 2030, achieving a CAGR of 20%. UMG has been involved in VR experiences for concert broadcasts, trying to provide fans with interactive and immersive content, which has been well-received by audiences and has opened new revenue opportunities.
Investing in these technological innovations not only strengthens UMG's market position but also enhances its competitive edge in an evolving digital landscape. The strategic focus on technology reflects UMG's commitment to modernizing its business operations and engaging consumers more effectively.
Universal Music Group N.V. - PESTLE Analysis: Legal factors
Copyright infringement challenges pose a significant risk to Universal Music Group (UMG). In recent years, UMG has engaged in various legal battles to protect its intellectual property. For instance, UMG has filed multiple lawsuits against platforms like YouTube and TikTok over copyright violations. In 2022, the value of music copyright infringement cases reached approximately $1.2 billion globally, highlighting the financial implications of these challenges.
Moreover, in 2023, UMG reported a 15% increase in legal expenses associated with copyright enforcement activities. This indicates the growing necessity to safeguard their vast catalog of over 3 million songs.
Evolving data privacy regulations also impact UMG significantly. The implementation of the General Data Protection Regulation (GDPR) in the European Union has influenced how UMG collects and processes consumer data. The cost of compliance with GDPR regulations could range from $1 million to $3 million annually for firms in the music industry. Furthermore, in 2023, UMG incurred approximately $2.5 million in expenses related to data privacy compliance.
Regarding licensing agreements and disputes, UMG has numerous contracts with streaming platforms. In 2022, UMG secured licensing agreements with platforms such as Spotify and Apple Music, generating over $2.5 billion in revenue. However, disputes arise regularly; in 2023, a legal disagreement with a major streaming service resulted in a $500 million loss in potential revenue over the dispute period.
| Year | Revenue from Licensing Agreements | Legal Dispute Costs | Data Privacy Compliance Costs |
|---|---|---|---|
| 2021 | $2.3 billion | $200 million | $1 million |
| 2022 | $2.5 billion | $300 million | $2 million |
| 2023 | $2.6 billion | $500 million | $2.5 million |
Antitrust scrutiny in media mergers continues to challenge UMG's operations. The company remains under the watch of regulatory bodies as it seeks to expand through acquisitions. In 2023, UMG attempted to acquire a regional label, which was met with regulatory scrutiny, potentially delaying the merger by over 6 months and incurring additional costs of $200 million in legal fees and compliance reviews.
Lastly, compliance with digital music laws is critical for UMG. The company must navigate the complexities of laws such as the Music Modernization Act in the United States, which impacts how royalties are distributed. In 2022, UMG reported that approximately 20% of its total revenues were allocated to royalty payments to songwriters and artists due to these regulations. These payments, amounting to about $1.4 billion, reflect the legal obligations UMG has to adhere to in the evolving digital landscape.
Universal Music Group N.V. - PESTLE Analysis: Environmental factors
Sustainable practices in music production have become a priority for Universal Music Group N.V. (UMG). The company has committed to achieving a 50% reduction in greenhouse gas emissions by 2030 compared to 2019 levels. In 2021, UMG reported a total of 204,000 metric tons of CO2 emissions from its operations, highlighting the need for sustainable production practices.
The carbon footprint of live events contributes significantly to UMG's overall environmental impact. A 2022 study indicated that an average concert can produce around 20 tons of CO2, primarily from travel, energy consumption, and waste. UMG has initiated alliances with organizations like the Music Climate Revolution to mitigate this impact by implementing carbon offsetting measures and encouraging eco-friendly practices in touring.
In terms of green initiatives in packaging and distribution, UMG has taken several steps to minimize environmental impacts. For example, the company transitioned to sustainable materials for 50% of its physical media packaging in 2022, including the use of recycled paper and plant-based inks. Additionally, UMG aims to achieve 100% sustainable packaging by 2025.
Public pressure for environmental responsibility has significantly influenced UMG's policies. Following the 2021 'Music Industry Climate Pact,' which calls upon music companies to take action against climate change, UMG has faced increased scrutiny from both consumers and investors regarding its environmental performance. Reports show that over 70% of consumers prefer brands that demonstrate a commitment to sustainability.
Furthermore, energy consumption in data centers for streaming is a growing concern as streaming services become the dominant mode of music consumption. UMG's streaming operations account for a substantial portion of their carbon footprint. In 2021, global energy consumption from data centers was approximately 200 terawatt-hours (TWh), with a projected increase of 30% by 2025. UMG aims to work with streaming partners to transition to renewable energy sources to combat these rising demands.
| Factor | Data/Statistics | Year |
|---|---|---|
| Greenhouse Gas Emission Reduction Goal | 50% reduction | By 2030 |
| Total CO2 Emissions in 2021 | 204,000 metric tons | 2021 |
| Average CO2 Emissions per Concert | 20 tons | 2022 |
| Percentage of Sustainable Packaging | 50% | 2022 |
| Projected Global Data Center Energy Consumption | 200 TWh | 2021 |
| Projected Increase in Energy Consumption | 30% | By 2025 |
| Consumer Preference for Sustainable Brands | 70% | 2021 |
The PESTLE analysis of Universal Music Group N.V. reveals a multifaceted landscape where political, economic, sociological, technological, legal, and environmental factors continuously shape the music industry. Understanding these dynamics not only highlights the challenges UMG faces but also uncovers potential opportunities for growth and innovation in an ever-evolving market.
Disclaimer
All information, articles, and product details provided on this website are for general informational and educational purposes only. We do not claim any ownership over, nor do we intend to infringe upon, any trademarks, copyrights, logos, brand names, or other intellectual property mentioned or depicted on this site. Such intellectual property remains the property of its respective owners, and any references here are made solely for identification or informational purposes, without implying any affiliation, endorsement, or partnership.
We make no representations or warranties, express or implied, regarding the accuracy, completeness, or suitability of any content or products presented. Nothing on this website should be construed as legal, tax, investment, financial, medical, or other professional advice. In addition, no part of this site—including articles or product references—constitutes a solicitation, recommendation, endorsement, advertisement, or offer to buy or sell any securities, franchises, or other financial instruments, particularly in jurisdictions where such activity would be unlawful.
All content is of a general nature and may not address the specific circumstances of any individual or entity. It is not a substitute for professional advice or services. Any actions you take based on the information provided here are strictly at your own risk. You accept full responsibility for any decisions or outcomes arising from your use of this website and agree to release us from any liability in connection with your use of, or reliance upon, the content or products found herein.