
|
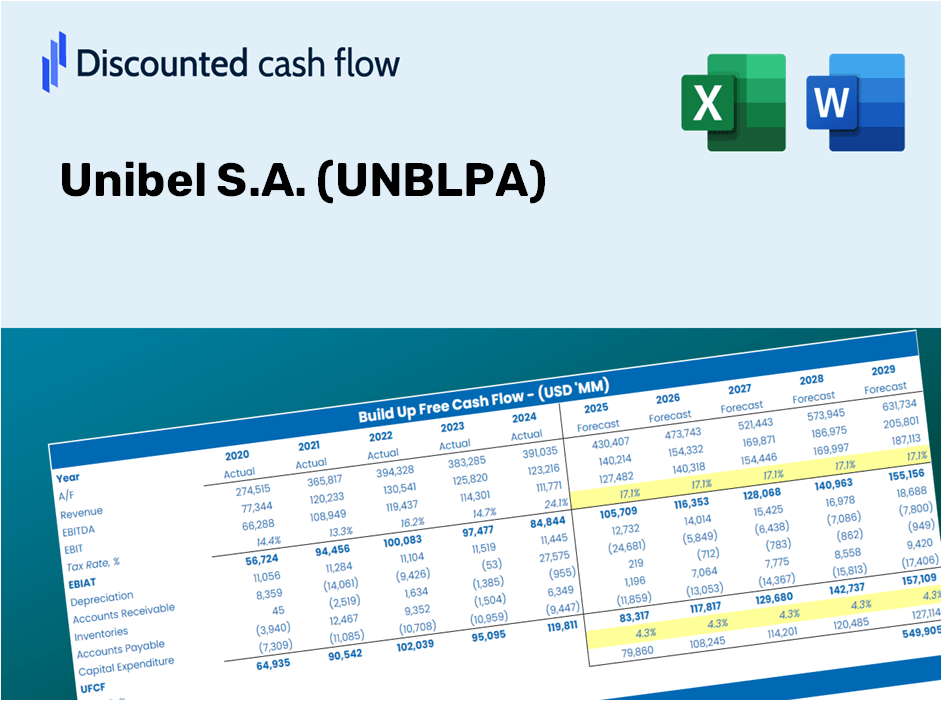
Unibel S.A. (UNBL.PA) DCF Valuation |
Fully Editable: Tailor To Your Needs In Excel Or Sheets
Professional Design: Trusted, Industry-Standard Templates
Investor-Approved Valuation Models
MAC/PC Compatible, Fully Unlocked
No Expertise Is Needed; Easy To Follow
Unibel S.A. (UNBL.PA) Bundle
Evaluate the financial prospects of Unibel S.A. like an expert! This (UNBLPA) DCF Calculator provides pre-filled financial data while allowing you complete flexibility to modify revenue growth, WACC, margins, and other essential assumptions to align with your predictions.
Benefits You Will Receive
- Pre-Filled Financial Model: Leverage Unibel S.A. (UNBLPA) data for accurate DCF valuation.
- Complete Forecast Control: Modify revenue growth, profit margins, WACC, and other essential parameters.
- Real-Time Calculations: Automatic updates provide immediate results as you make adjustments.
- Professional-Grade Template: A polished Excel file crafted for high-quality valuation purposes.
- Customizable and Reusable: Designed for adaptability, allowing ongoing use for comprehensive forecasts.
Key Features
- Comprehensive UNBLPA Data: Featuring Unibel S.A.'s historical financials alongside future projections.
- Fully Customizable Inputs: Modify revenue growth rates, profit margins, WACC, tax rates, and capital expenditures as needed.
- Dynamic Valuation Model: Instantaneous updates to Net Present Value (NPV) and intrinsic value in response to your adjustments.
- Scenario Testing: Generate various forecasting scenarios to evaluate different valuation results.
- User-Friendly Interface: Intuitive layout designed for both industry professionals and newcomers.
How It Works
- Step 1: Download the prebuilt Excel template containing Unibel S.A. (UNBLPA) data.
- Step 2: Navigate through the pre-filled sheets to familiarize yourself with the essential metrics.
- Step 3: Adjust forecasts and assumptions in the editable yellow cells (WACC, growth, margins).
- Step 4: Instantly see the recalculated results, including the intrinsic value of Unibel S.A. (UNBLPA).
- Step 5: Use the outputs to make well-informed investment choices or create detailed reports.
Why Choose the Unibel S.A. Calculator?
- All-in-One Solution: Integrates DCF, WACC, and financial ratio calculations in a single platform.
- Flexible Input Options: Modify the highlighted cells to explore different investment scenarios.
- In-Depth Analysis: Automatically computes Unibel S.A.'s intrinsic value and Net Present Value.
- Loaded with Data: Historical and projected data provide reliable starting points for analysis.
- High Standards: Perfect for financial analysts, investors, and business consultants.
Who Can Benefit from This Product?
- Individual Investors: Make well-informed choices regarding the purchase or sale of Unibel S.A. (UNBLPA) shares.
- Financial Analysts: Enhance valuation accuracy with ready-to-implement financial models tailored for Unibel S.A. (UNBLPA).
- Consultants: Provide rapid and precise valuation insights for your clients using data from Unibel S.A. (UNBLPA).
- Business Owners: Gain insights into the valuation methods of major firms like Unibel S.A. (UNBLPA) to inform your business strategy.
- Finance Students: Master valuation methods by engaging with real-world data and case studies from Unibel S.A. (UNBLPA).
Contents of the Template
- Pre-Filled Data: Contains Unibel S.A.’s historical financial performance and forecasts.
- Discounted Cash Flow Model: An editable DCF valuation model with automatic calculation features.
- Weighted Average Cost of Capital (WACC): A specific sheet for calculating WACC with customizable inputs.
- Key Financial Ratios: Assess Unibel S.A.'s profitability, efficiency, and leverage metrics.
- Customizable Inputs: Easily modify revenue growth, profit margins, and tax rates.
- Clear Dashboard: Visual charts and tables summarizing essential valuation outcomes.
Disclaimer
All information, articles, and product details provided on this website are for general informational and educational purposes only. We do not claim any ownership over, nor do we intend to infringe upon, any trademarks, copyrights, logos, brand names, or other intellectual property mentioned or depicted on this site. Such intellectual property remains the property of its respective owners, and any references here are made solely for identification or informational purposes, without implying any affiliation, endorsement, or partnership.
We make no representations or warranties, express or implied, regarding the accuracy, completeness, or suitability of any content or products presented. Nothing on this website should be construed as legal, tax, investment, financial, medical, or other professional advice. In addition, no part of this site—including articles or product references—constitutes a solicitation, recommendation, endorsement, advertisement, or offer to buy or sell any securities, franchises, or other financial instruments, particularly in jurisdictions where such activity would be unlawful.
All content is of a general nature and may not address the specific circumstances of any individual or entity. It is not a substitute for professional advice or services. Any actions you take based on the information provided here are strictly at your own risk. You accept full responsibility for any decisions or outcomes arising from your use of this website and agree to release us from any liability in connection with your use of, or reliance upon, the content or products found herein.