|
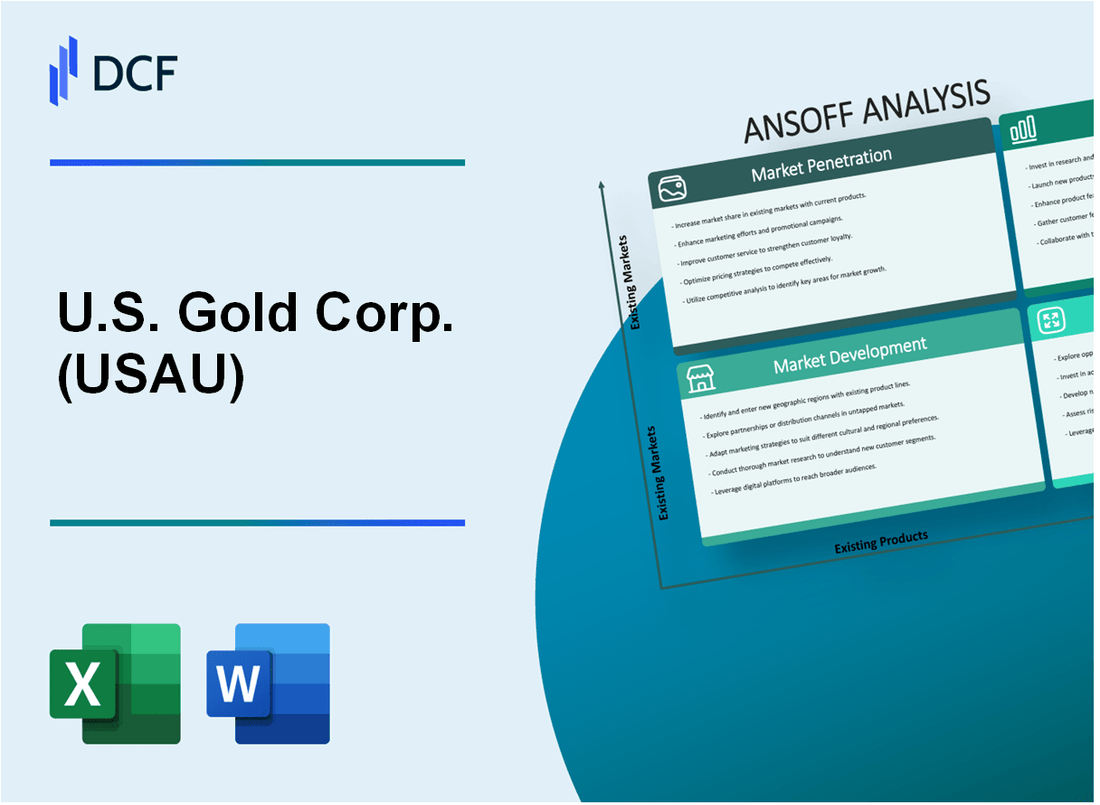
U.S. Gold Corp. (USAU): ANSOFF MATRIX [Dec-2025 Updated] |
Fully Editable: Tailor To Your Needs In Excel Or Sheets
Professional Design: Trusted, Industry-Standard Templates
Investor-Approved Valuation Models
MAC/PC Compatible, Fully Unlocked
No Expertise Is Needed; Easy To Follow
U.S. Gold Corp. (USAU) Bundle
You are looking at a pre-production gold-copper story, and frankly, the next 18 months for U.S. Gold Corp. are all about execution to de-risk that \$277 million CK Gold Project while aggressively building out the exploration asset base. As a former head analyst, I see four clear paths here: locking down US financing and off-take (Market Penetration), finding international buyers or partners (Market Development), proving up new value like a silver stream or Keystone resource (Product Development), and even looking at non-mining ventures in Wyoming (Diversification). The near-term focus has to be on hitting that January 2026 DFS milestone and using the low projected \$937 per ounce AISC to attract US gold funds, aiming to move that \$0.22 billion market capitalization. This matrix shows exactly where the near-term opportunities and risks lie for U.S. Gold Corp. right now.
U.S. Gold Corp. (USAU) - Ansoff Matrix: Market Penetration
You're looking to solidify U.S. Gold Corp.'s position in the existing US market, which means driving the CK Gold Project from its advanced, fully-permitted status into full-scale domestic production. This is about maximizing sales of your current core asset to your current core customer base-the US and international metals markets-by de-risking the financing and production profile.
Secure 100% of future CK Gold concentrate sales via US-based off-take agreements.
Securing off-take agreements is critical for locking in revenue streams before breaking ground. This strategy directly addresses market acceptance for the CK Gold Project's output. The project's economics, based on the February 2025 Pre-Feasibility Study (PFS), show a life-of-mine average All-in Sustaining Cost (AISC) of $937 per ounce of gold equivalent (AuEq). This low-cost profile makes the concentrate highly attractive to buyers. You've already received interest from concentrate buyers, which is a great sign that the market sees the value in the expected output of 680,000 oz. of gold, 208 million lb. of copper, and 2 million oz. of silver in gold equivalent terms over the 10-year mine life based on current reserves. The goal here is to convert that interest into firm, US-based commitments to secure the sales side of the equation.
Finalize project financing with US debt providers to cover the $277 million CAPEX.
The next major hurdle for market penetration is funding the transition to production. The initial capital requirement (CAPEX) for the CK Gold Project is established at $277 million. You've been clear that you see avenues to secure significant debt financing from interested parties, aiming to apply this capital in a way that minimizes shareholder dilution. The project's strong economics-a base case Internal Rate of Return (IRR) of 36% and a pre-tax Net Present Value (NPV) of $459 million at a 5% discount-make it a compelling target for US debt providers. If onboarding takes too long, the target construction start of late 2025 or early 2026 could slip, so securing that debt package is your near-term action item.
Target US institutional investors to increase market capitalization from $0.22 billion.
To support the project financing and reflect the asset's value, increasing the market capitalization is key. As of December 2025, U.S. Gold Corp.'s market cap hovers around $0.24 billion to $0.25 billion, though the prompt sets the baseline for this strategy at $0.22 billion. Currently, individual investors control about 56% of the company, while institutions hold 23%. The strategy is to shift this balance by presenting the de-risked, fully-permitted asset to major US funds. You've already been engaging this group, presenting at the invitation-only 2025 Precious Metals Summit in Beaver Creek, Colorado, in September 2025. BlackRock, Inc. is already on the shareholder list, showing some existing institutional interest.
Promote CK Gold's low All-in Sustaining Cost of $937 per ounce to US gold funds.
The cost structure is your competitive edge in the current market. The life-of-mine average AISC is $937 per ounce AuEq, which is a significant improvement over the previous estimate of $800. This low operating cost underpins the project's robust payback period, estimated between 1.1 to 1.7 years. Highlighting this figure, especially against higher-cost producers, directly appeals to the financial discipline of US gold funds looking for high-margin, near-term production assets. The project is poised to generate $693 million in pre-tax free cash flow over its mine life.
Leverage the fully-permitted status in Wyoming to attract US-focused infrastructure funds.
The regulatory certainty of the CK Gold Project is a massive differentiator. It is one of the few shovel-ready gold-copper projects in the US, having secured its final key Air Quality Permit in November 2024, making it fully permitted. This de-risked status, combined with its location in the mining-friendly jurisdiction of Wyoming, opens the door to infrastructure funds that prefer assets with minimal permitting risk and clear timelines toward production, targeted for 2027 or 2028. The Feasibility Study is expected to wrap up by late 2025, providing the final technical sign-off needed for these large capital partners.
| Metric | Value | Context/Reference Point |
| Targeted CAPEX | $277 million | Initial Capital Requirement for CK Gold Project |
| Life-of-Mine AISC | $937 per ounce | Gold Equivalent (AuEq) |
| Base Case IRR | 36% | At $2,100/oz Gold / $4.00/lb Copper |
| Projected Pre-Tax FCF | $693 million | Over 10.2-year mine life |
| Market Cap Baseline (Target) | $0.22 billion | Starting point for penetration strategy [cite: prompt] |
| Latest Reported Market Cap | $249.55 million | As of December 4, 2025 |
- Permitting complete as of November 2024.
- Feasibility Study completion targeted for late 2025.
- Institutional ownership stands at 23%.
- Upside Scenario IRR reaches 60%.
- Payback period estimated at 1.7 years.
Finance: finalize debt provider term sheet drafts by January 31, 2026.
U.S. Gold Corp. (USAU) - Ansoff Matrix: Market Development
You're looking at taking the fully permitted CK Gold Project in Southeast Wyoming-a shovel-ready asset-into the global market for financing and sales. This is about taking what you have built domestically and finding the best international partners and buyers to de-risk and fund the next phase.
Presenting at International Venues
To capture international investor interest necessary for financing, U.S. Gold Corp. actively engaged in market development by presenting at key global forums. Specifically, the company participated in Mines & Money @ Resourcing Tomorrow in London, United Kingdom, from December 2-4, 2025. President & CEO, Mr. George Bee, delivered the corporate presentation on Tuesday, December 2 at 14:10. This type of visibility is crucial for attracting the global capital needed for construction.
Negotiating Off-Take Agreements for CK Gold Concentrate
The CK Gold Project concentrate is proving highly attractive to international buyers because of its quality. The biggest offtake companies in the world are talking to U.S. Gold Corp. right now, driven by a global scarcity of clean concentrate. The concentrate is exceptionally clean, packing approximately 22% copper, upwards of 50 to 55 g/t gold, and 5 to 6 ounces of silver per tonne. This lack of penalty-bearing impurities makes it desirable for smelters in Asia and Europe, who are currently facing supply constraints, such as the structural stress in the global copper market where some Chinese smelters plan to cut production by more than 10% in 2026. Securing an off-take agreement locks in a revenue stream before construction is complete.
Accessing New Capital via Market Visibility
While a secondary international exchange listing wasn't confirmed in the latest data, U.S. Gold Corp. achieved a significant milestone to broaden its investor base and access capital markets by joining the Russell 3000 and Russell 2000 Indexes on June 30, 2025. This inclusion exposes USAU to an estimated $10.6 trillion in assets benchmarked against the Russell U.S. Indexes, enhancing visibility among institutional investors who track these benchmarks automatically.
Sharing Construction Risk with Global Partners
The next major step involves securing financing to cover the estimated capital required for construction. The Preliminary Feasibility Study (PFS) from February 2025 indicated a need for an estimated $300 million in capital for construction. The strategy here is to attract a major global miner to partner, thereby sharing this substantial initial risk. The company is advancing financing discussions, with the CEO anticipating a 'bidding war' over financing once the final feasibility study is released, which is expected in January 2026.
Here's a quick look at the core economics driving the need for this market development and partnership:
- Targeted annual gold equivalent production: approximately 110,000 ounces.
- Projected mine life: initial 10 years.
- All-in sustaining cost (AISC) from PFS: $940 per ounce (at $2,400 gold).
- Pre-tax Internal Rate of Return (IRR) from February 2025 PFS: 36% (at $2,100 gold).
- Pre-tax Net Present Value (NPV) at 5% discount from February 2025 PFS: $459 million (at $2,100 gold).
The market development strategy hinges on translating these strong domestic project metrics into international financial commitments. The table below summarizes key financial and operational data points relevant to attracting global partners and buyers.
| Metric Category | Financial/Statistical Figure | Context/Basis |
| Estimated Construction Capital | $300 million | CK Gold Project Capital Requirement Estimate |
| Gold Price Baseline (PFS) | $2,100 per ounce | February 2025 Pre-Feasibility Study Assumption |
| Copper Price Baseline (PFS) | $4.10 per pound | February 2025 Pre-Feasibility Study Assumption |
| Projected Annual Gold Equivalent Production | 110,000 ounces | Targeted over initial 10-year mine life |
| Reported Concentrate Copper Grade | 22% | Concentrate specification for off-take discussions |
| Reported Concentrate Gold Grade | 50 to 55 g/t | Concentrate specification for off-take discussions |
| Russell Index Inclusion Date | June 30, 2025 | FTSE Russell Annual Reconstitution |
The goal is to secure a partner to share the $300 million construction risk, leveraging the clean concentrate's appeal to off-takers and the increased investor visibility from the Russell Index inclusion to finalize project financing in H1 2026.
U.S. Gold Corp. (USAU) - Ansoff Matrix: Product Development
You're looking at how U.S. Gold Corp. plans to develop its existing and new assets, which is the Product Development quadrant of the Ansoff Matrix. This is about taking what you have-your geological assets-and improving them or developing them further to create new value streams. Here's the quick math on the key technical and financial milestones driving this strategy.
Fast-track exploration at the Keystone Project (Nevada) to establish a maiden gold resource
The Keystone Project sits on the prolific Cortez Gold Trend in Nevada, a district that has produced over 245 million ounces of gold in the last 50 years. You're focusing exploration here because of the geological potential, even though the main development push is in Wyoming. The 2019 drilling program hit what was called the strongest continuous gold mineralization ever encountered at Keystone in hole Key19-01c. You are currently evaluating partnership opportunities to fund systematic drilling to establish a maiden resource. One nearby target, the Keystone Jumbo high-grade target, has non-compliant Historic Resources that you aim to convert into a compliant NI 43-101 Mineral Resource Estimate (MRE). This historical estimate in the area covered by a neighbor was approximately 1,652,325 tonnes grading 5.89 g/t gold for a total of 303,949 oz contained gold in the inferred category. Honestly, getting a compliant resource here could dramatically expand your asset base.
Complete metallurgical studies to optimize a separate silver concentrate stream from CK Gold
While the primary focus of recent optimization studies at the CK Gold Project has been on improving overall metal recovery, the existing reserve base already quantifies significant silver. The February 2025 Prefeasibility Study (PFS) estimated total production over the mine life to include 2.04 million ounces of silver, or 3 million ounces of silver within the mineral reserves. The base case metal price assumption used for that study valued silver at $27 per ounce. The ongoing metallurgical work, particularly with the Jameson Cell adoption, is aimed at the gold and copper concentrate stream, but any improvement in overall recovery benefits all payable metals.
Advance the Challis Gold Project (Idaho) to a pre-resource drilling stage for a new asset
The Challis Gold Project in Idaho represents a new product in your portfolio, and you're moving it toward a Plan of Operations (PoO) for exploration. This project holds a historic inferred resource totaling 313,825 ounces of gold at a grade of 1.22 g/t. Exploration activities, including geological mapping and sampling to define gold structures, can commence once the necessary bond is in place. You've also seen interest from potential partners for joint ventures to help fund and execute the next phase of drilling.
Release the Definitive Feasibility Study (DFS) in January 2026 to de-risk the existing asset
De-risking the CK Gold Project is paramount before construction financing. The Definitive Feasibility Study (DFS) is targeted for completion in mid-December 2025, with the official public release planned for January 2026. This timing is strategic to avoid the holiday period and immediately trigger the full suite of project financing discussions. The DFS builds upon the updated PFS from February 2025, which already showed robust economics.
Investigate Glencore's Jameson cells to defintely improve concentrate quality and marketability
You've made the strategic decision to incorporate Glencore Technology's Jameson Cell flotation technology into the CK Gold Project's processing flowsheet, a key finding from studies completed within the DFS process. This technology is confirmed to offer improvements over conventional flotation cells, including increased metal recovery, reduced power consumption, and a smaller equipment and warehousing footprint. Independent trade-off studies by Halyard Micon International estimated this adoption could increase the project's Net Present Value (NPV, 5%) by approximately $36 million over the mine's lifespan. To secure cost certainty, U.S. Gold Corp. obtained a letter guaranteeing the pricing of unused Jameson Cells until October 2025.
Here's a look at the key economic parameters from the February 2025 PFS that the DFS is refining:
| Metric | Value (Base Case: $2,100 Gold / $4.10 Copper) | Value (Higher Price Case: $3,000 Gold / $4.50 Copper) |
|---|---|---|
| Pre-Tax Net Present Value (NPV, 5%) | $459 million | $952 million |
| Internal Rate of Return (IRR) | 36.0% | Not explicitly stated, but significantly higher |
| Payback Period | 1.7 years (Improved by 15%) | Shorter than 1.7 years |
| All-in Sustaining Costs (AISC) | $937 per gold-equivalent ounce | Lower in real terms due to higher metal prices |
| Initial Capital Requirement | $277 million | Not explicitly stated to change |
The Product Development focus is clearly on maximizing the value of the CK asset through engineering refinement before moving to financing. Still, you're keeping the exploration pipeline active at Keystone and Challis, which represent future product expansion opportunities.
- Keystone Project: Located on the Cortez Trend, a district that has produced over 245 million ounces of gold.
- Challis Gold Project: Historic inferred resource of 313,825 ounces of gold at 1.22 g/t.
- CK Gold Project: Expected average annual production of 111,250 gold-equivalent ounces over 10.2 years.
- Jameson Cell NPV Uplift: Estimated $36 million increase to CK Project NPV (5%).
Finance: draft the 13-week cash view incorporating the expected Q4 2025 capital needs by Friday.
U.S. Gold Corp. (USAU) - Ansoff Matrix: Diversification
You're looking at how U.S. Gold Corp. (USAU) might expand beyond its core gold and copper focus, which is smart given the current market. The CK Gold Project in Wyoming is the near-term cash engine, but diversification is about building out the other side of the ledger. Here are the concrete numbers grounding those potential moves.
Acquire a minority stake in a US-based battery metal (e.g., lithium) exploration project
Moving into battery metals like lithium is a play on critical mineral security, which has seen direct government backing. For context, the U.S. government secured a 5 percent equity stake in Lithium Americas Corporation and a separate 5 percent stake in the Thacker Pass project as part of a $435 million funding package from the Department of Energy (DOE). Also, the Department of Defense made a $400 million equity investment in MP Materials. If U.S. Gold Corp. were to target a similar minority stake, the capital required would be benchmarked against these large government-backed deals. For instance, Thacker Pass Phase 1 is projected to produce 40,000 metric tons of battery-quality lithium carbonate per year. U.S. Gold Corp. closed at $16.86 on December 1, 2025, with a 52-week range of $5.86 - $19.20, giving you a current market capitalization reference point to calculate potential minority investment costs.
Form a joint venture to develop a non-mining asset, like a renewable energy project in Wyoming
The most concrete non-mining asset value tied to U.S. Gold Corp. is the post-mining land use at the CK Gold Project. The open pit, which is 86 acres by 700 feet deep at its deepest point, could be repurposed to more than double the water storage capacity for the township of Cheyenne. This offers a tangible, non-metal revenue or partnership opportunity. The core project itself has 1.7 million gold equivalent ounces in reserves, targeting 110,000 GEO annually over a 10-year mine life, with an All-In Sustaining Cost (AISC) of $940 per ounce based on a $2,400 gold price. The initial capital estimate from the Pre-Feasibility Study (PFS) was $221 million.
Use the CK Gold Project's infrastructure to offer contract crushing services to local quarries
The similarity between the CK Gold Project's ore mining process and local rock quarries suggests an avenue for service revenue. Beyond the primary metal production, the project economics already factor in revenue from aggregate sales, estimated to add $10-15 million annually. This figure represents a direct, quantifiable revenue stream from using the site infrastructure for non-core material handling. The mine is designed for a nominal rate of 18,150 tonnes per day (tpd) of ore processing, which provides a scale reference for potential contract crushing throughput capacity.
Here's a look at the core project economics that would fund this diversification:
| Metric | Value |
| Target Annual Production (GEO) | 110,000 ounces |
| Life of Mine (LOM) | 10 years |
| Contained Gold Reserves (Ounces) | 1,000,000 |
| Contained Copper Reserves (Pounds) | 260,000,000 |
| All-in Sustaining Cost (AISC) | $940 per ounce |
| PFS Capital Investment | $221m |
Explore a new US state, like Arizona, for a non-core base metal asset acquisition
Acquiring a non-core base metal asset requires capital capacity. U.S. Gold Corp. had a forecasted annual EBIT of -12MM USD for the period ending June 30, 2025. Analyst consensus price targets for USAU as of September 25, 2025, ranged from a low of $15 to a high of $22, with an average of $19. The closing stock price on December 1, 2025, was $16.86. Any acquisition would need to be financed, likely through debt, as the company plans to fund the CK mine buildout primarily through debt to avoid equity dilution. The company also holds exploration assets in Nevada (Keystone and Maggie Creek) and Idaho (Challis Gold project).
Potential strategic focus areas for base metal exploration upside include:
- Leveraging proximity to established mining complexes, such as the Nevada assets being 11 miles from Barrick's Cortez complex.
- Targeting copper-gold deposits, given the CK Project's dual metal nature.
- Assessing states like Arizona, which has a history of base metal production, for assets that fit a non-core, high-upside profile.
- Evaluating the potential for a project that could generate production in the 100 plus thousand ounce range, as mentioned in strategic discussions.
Disclaimer
All information, articles, and product details provided on this website are for general informational and educational purposes only. We do not claim any ownership over, nor do we intend to infringe upon, any trademarks, copyrights, logos, brand names, or other intellectual property mentioned or depicted on this site. Such intellectual property remains the property of its respective owners, and any references here are made solely for identification or informational purposes, without implying any affiliation, endorsement, or partnership.
We make no representations or warranties, express or implied, regarding the accuracy, completeness, or suitability of any content or products presented. Nothing on this website should be construed as legal, tax, investment, financial, medical, or other professional advice. In addition, no part of this site—including articles or product references—constitutes a solicitation, recommendation, endorsement, advertisement, or offer to buy or sell any securities, franchises, or other financial instruments, particularly in jurisdictions where such activity would be unlawful.
All content is of a general nature and may not address the specific circumstances of any individual or entity. It is not a substitute for professional advice or services. Any actions you take based on the information provided here are strictly at your own risk. You accept full responsibility for any decisions or outcomes arising from your use of this website and agree to release us from any liability in connection with your use of, or reliance upon, the content or products found herein.