
|
USCB Financial Holdings, Inc. (USCB): 5 FORCES Analysis [Nov-2025 Updated] |
Fully Editable: Tailor To Your Needs In Excel Or Sheets
Professional Design: Trusted, Industry-Standard Templates
Investor-Approved Valuation Models
MAC/PC Compatible, Fully Unlocked
No Expertise Is Needed; Easy To Follow
USCB Financial Holdings, Inc. (USCB) Bundle
You're looking to cut through the noise and see exactly where USCB Financial Holdings, Inc. stands competitively in South Florida, so here's the quick, unvarnished truth: management is delivering a solid punch with a 15.74% ROAE in Q3 2025, but the market is squeezing from every angle. Honestly, while high regulatory walls keep most new community banks out, the bank is heavily dependent on third-party tech suppliers for 78% of its infrastructure, and customers are getting picky, slowing deposit growth to just 4.5% annualized by Q2 2025. Add in the massive, fast-moving threat from Fintech platforms, which are expanding at a 19.8% CAGR, and you see a tight squeeze for this $2.8 billion asset bank. Keep reading; we break down the leverage points for suppliers, customers, rivals, substitutes, and new entrants below so you can see the precise risks and opportunities shaping USCB's next move.
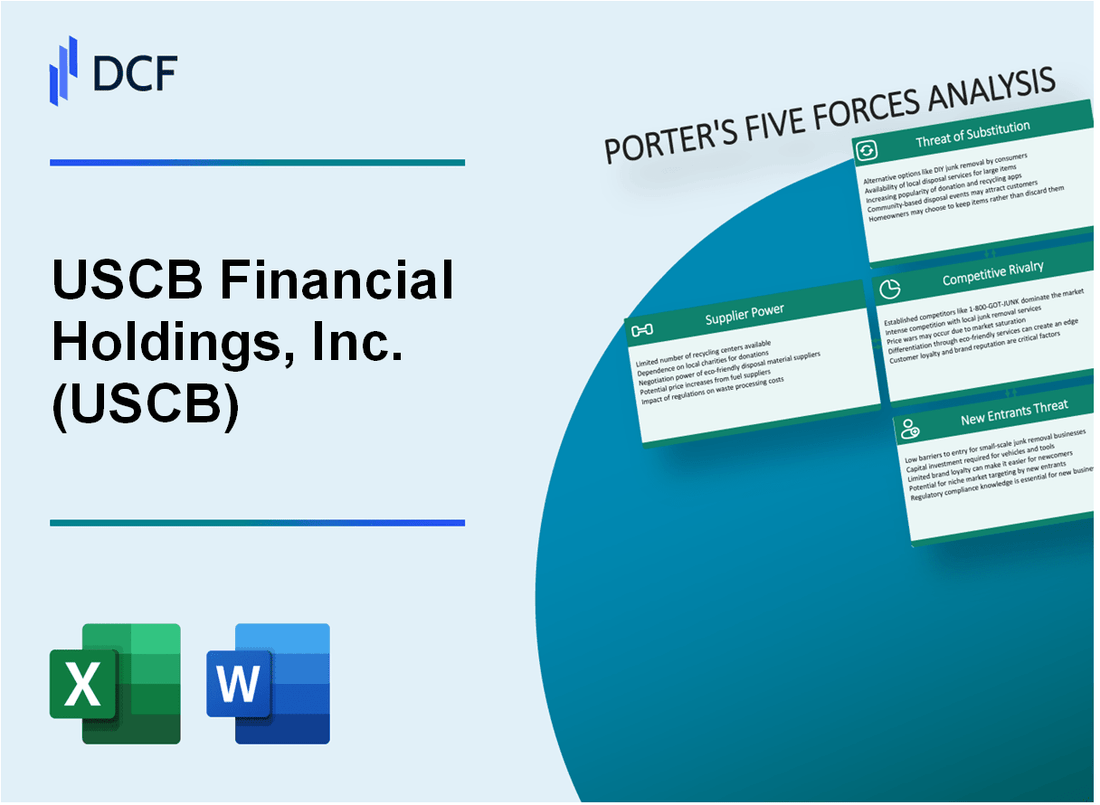
USCB Financial Holdings, Inc. (USCB) - Porter's Five Forces: Bargaining power of suppliers
When you look at the suppliers for USCB Financial Holdings, Inc. (USCB), you are really looking at the providers of critical infrastructure, capital, and specialized talent. For a bank of this size, which is one of the largest community banks headquartered in the Miami-Dade metro area, the power these groups hold can significantly impact operational flexibility and cost structure.
The technology backbone is a major area of supplier influence. USCB Financial Holdings, Inc. shows a clear dependency here:
- Reliance on third-party core banking vendors for 78% of infrastructure.
- Annual technology vendor spending is an estimated $3.7 million, creating dependency.
This level of reliance on core systems means switching costs are high, giving those few core vendors considerable leverage over USCB Financial Holdings, Inc. regarding pricing, service level agreements, and upgrade timelines. Here's the quick math: if that $3.7 million represents a significant portion of the bank's non-interest expense base, any annual increase translates directly to margin pressure.
Now, let's look at capital suppliers-that is, the investors providing equity and debt. Their power is notably constrained by the bank's strong capital position as of late 2025. As of September 30, 2025, USCB Financial Holdings, Inc.'s Total Risk-Based Capital Ratio stood at 14.20%. This is well above regulatory minimums, which means the bank is not desperate for capital, thus keeping the bargaining power of equity investors relatively low.
The power dynamic shifts when considering human capital, specifically highly skilled personnel. The Miami MSA is a competitive talent market, and for a specialized institution like USCB Financial Holdings, Inc., retaining top-tier banking executives is paramount. This scarcity translates into higher compensation demands.
Here is a snapshot of the key supplier categories and their relative power:
| Supplier Category | Key Dependency/Metric | Supplier Power Assessment |
|---|---|---|
| Core Technology Vendors | 78% of infrastructure reliance | High |
| Capital Providers (Equity/Debt) | Total Risk-Based Capital Ratio: 14.20% (as of 9/30/2025) | Low |
| Specialized Talent (Executives) | Miami MSA scarcity | Medium to High |
| General IT/Software Providers | Estimated annual spend: $3.7 million | Medium |
To be fair, the high capital ratio of 14.20% provides a strong buffer against investor pressure, but the operational risk tied to core technology remains a constant negotiation point. The bank's ability to manage vendor contracts effectively will be key to controlling operating expenses, especially given the reported efficiency ratio improvement to 52.79% for Q3 2025.
The scarcity of local, highly skilled banking executives in the Miami area means USCB Financial Holdings, Inc. must compete aggressively for talent. This is a localized supply constraint that directly impacts operational quality and succession planning.
- Executive talent is a scarce resource in the Miami MSA.
- Strong capital position limits investor leverage.
- Core vendor lock-in creates operational risk.
Finance: draft Q4 2025 vendor contract review schedule by next Tuesday.
USCB Financial Holdings, Inc. (USCB) - Porter's Five Forces: Bargaining power of customers
You're looking at USCB Financial Holdings, Inc. from the customer's perspective, and honestly, the power dynamic is a mixed bag. For commodity-like services, customers have leverage, but for deep relationships, USCB Financial Holdings, Inc. has built in some stickiness.
Depositors definitely have a voice, especially in the current rate environment. Competitive deposit pricing is a noted headwind for USCB Financial Holdings, Inc. because customers are shopping around for the best yield on their cash. The market is telling you something when deposit growth momentum shifts.
We saw this clearly in the second quarter of 2025. Deposit growth slowed to a 4.5% annualized rate in Q2 2025, which is a sharp deceleration from the 25% annualized rate seen in Q1 2025. That drop signals clear customer rate sensitivity; they are moving money where they get a better return, or perhaps where they perceive better stability for the rate offered. By the end of Q3 2025, total deposits stood at $2.5 billion, showing that while growth slowed, the base is still expanding, albeit more cautiously from the customer side.
Here's a quick look at how the deposit environment has been shifting across recent quarters, which directly impacts customer bargaining power:
| Metric | Q1 2025 | Q2 2025 | Q3 2025 |
|---|---|---|---|
| Annualized Deposit Growth Rate | 25% | 4.5% | N/A (Y/Y growth was 15.5%) |
| Total Deposits (End of Period) | Implied Lower | $2.3 Billion | $2.5 Billion |
| Net Interest Margin (NIM) | 3.10% | 3.28% | 3.14% |
| Cost of International Deposits | N/A | 1.74% | N/A |
The NIM, which was 3.28% in Q2 2025, shows USCB Financial Holdings, Inc. is managing its asset side well, but the pressure on deposit costs is real. To be fair, management noted that the cost of their international deposits was relatively low at 1.74% as of Q2 2025, which helps offset domestic competition, but it doesn't eliminate the underlying customer demand for better rates.
When you look at the commercial segment, the power depends entirely on the product type you are analyzing. For basic lending and deposit products, commercial clients face low switching costs. If USCB Financial Holdings, Inc. isn't offering a superior service or a highly competitive rate on a simple operating account or a standard commercial loan, they can definitely walk. It's a transactional relationship, and that means the customer holds the cards.
However, the dynamic flips when you consider relationship-based clients. For clients like Homeowners Associations (HOAs) and Small to Medium-sized Businesses (SMBs), the switching costs are high. USCB Financial Holdings, Inc. emphasizes its relationship-driven approach, particularly with SMBs and the South Florida condominium market. This implies that the value is embedded in more than just the rate sheet.
The higher switching costs for these groups stem from several factors:
- Integration of treasury management services.
- Existing, complex commercial loan structures.
- Deep, established personal and business banking ties.
- Reliance on specialized SBA lending relationships.
If onboarding takes 14+ days, churn risk rises for transactional accounts, but for a deeply embedded SMB client, the administrative burden of moving complex services keeps them anchored, giving USCB Financial Holdings, Inc. more pricing flexibility in those specific niches.
Finance: draft 13-week cash view by Friday.
USCB Financial Holdings, Inc. (USCB) - Porter's Five Forces: Competitive rivalry
Competitive rivalry in the Miami-Dade MSA is characterized by the presence of numerous players, ranging from local community institutions to much larger regional and national entities. USCB Financial Holdings, Inc. operates with total assets of $2.8 billion as of September 30, 2025.
This scale places USCB Financial Holdings, Inc. at a distinct disadvantage in terms of market influence when compared to its regional peers:
- Byline Bancorp reported total assets of $9.8 billion as of September 30, 2025.
- ConnectOne Bancorp reported total assets of $14.02 billion as of September 30, 2025.
The bank's small scale, with $2.8 billion in assets, limits its ability to dictate pricing or terms across the broader market.
Despite the competitive environment, USCB Financial Holdings, Inc. demonstrated strong profitability in the third quarter of 2025. Its annualized Return on Average Equity (ROAE) for Q3 2025 was 15.74%. This performance is a strong indicator of operational efficiency when benchmarked against the available metrics for its rivals:
| Rival Peer | Q3 2025 Asset Size (Approximate) | Key Profitability Metric (Q3 2025) |
| USCB Financial Holdings, Inc. (USCB) | $2.8 billion | ROAE: 15.74% |
| Byline Bancorp | $9.8 billion | ROTCE: 15.11% (Reported) |
| ConnectOne Bancorp | $14.02 billion | Operating ROAA: 1.05% |
For context on the peer performance, Byline Bancorp reported a Return on Average Tangible Common Equity (ROTCE) of 15.11%, while ConnectOne Bancorp reported an Operating Return on Average Assets (ROAA) of 1.05%.
The intensity of rivalry is further suggested by the operational focus of these competitors:
- Byline Bancorp is focused on becoming the preeminent commercial bank in Chicago.
- ConnectOne Bancorp's asset base significantly increased following its June 1, 2025 merger with The First of Long Island Corporation (FLIC).
USCB Financial Holdings, Inc. (USCB) - Porter's Five Forces: Threat of substitutes
The threat of substitutes for USCB Financial Holdings, Inc. remains elevated, driven by the rapid evolution of non-bank financial technology solutions that offer comparable or superior convenience and, in some cases, better pricing for specific services. You need to watch these alternatives closely because they directly compete for both your customers' transaction flows and their core deposit base.
Fintech platforms represent a significant and growing competitive force. The global market is expanding at a compound annual growth rate (CAGR) of 19.8%, indicating sustained, aggressive growth in technology-driven financial services that bypass traditional banking channels. This growth fuels innovation across lending, payments, and wealth management, directly challenging USCB Financial Holdings, Inc.'s traditional revenue streams.
In the payments space, digital platforms are capturing an ever-larger share of transaction volume. Specifically, these platforms are estimated to capture 64.4% of transaction volume in the sector, a figure that underscores the shift away from traditional bank-intermediated payments. This means fewer routine transactions-the lifeblood of many bank relationships-are flowing through USCB Financial Holdings, Inc.'s infrastructure.
The lending landscape is also being reshaped by non-bank entities that can often move faster than regulated institutions. Non-bank commercial lenders and direct online mortgage providers are increasingly effective at bypassing the bank entirely for certain segments. For instance, in middle market lending, private credit's market share in middle market lending grew to a projected 40% by 2025, up from 20% in 2018. Furthermore, in commercial real estate, alternative lenders (debt funds and mortgage REITs) comprised 19% of non-agency loan closings in Q1 2025, and projections suggest the non-bank lending market share could reach 25% due to regulatory dynamics. For mortgages, the total U.S. origination volume is expected to hit $2.3 trillion in 2025, with online brokers still competing despite industry revenue declining at a CAGR of 6.6% to $647.5 million by 2025.
For core funding, traditional bank deposits face direct substitution from cash management vehicles that appeal to yield-seeking investors. Money market funds (MMFs) and Treasury bills offer a close substitute for safety and liquidity. The combined assets under management (AUM) for bank deposits and MMFs exceed $20 trillion, highlighting the massive pool of capital that can flow between these two asset classes based on relative attractiveness.
The dynamic between these two safe-haven assets shows a measurable substitution effect, which USCB Financial Holdings, Inc. must monitor:
| Relationship Metric | Observed Effect (Average 1995-2025) |
| Bank Deposit Increase vs. MMF Assets | A 1-percentage-point increase in bank deposits is associated with a 0.2-percentage-point decline in MMF assets |
| Combined Bank Deposits & MMF Assets | Exceed $20 trillion |
The intensity of this substitution is not static; it is highly sensitive to the interest rate environment and overall system liquidity. When MMF yields substantially exceed deposit rates, the flow from bank deposits into MMFs becomes markedly more pronounced. This means that as a regional bank, USCB Financial Holdings, Inc. must compete aggressively on deposit pricing to prevent this outflow of core funding.
Key areas where substitutes are eroding the traditional banking model include:
- Fintech platforms growing at a 19.8% CAGR.
- Digital wallets capturing 64.4% of transaction volume.
- Private credit expected to hold 40% of middle market lending by 2025.
- Total U.S. mortgage originations projected at $2.3 trillion in 2025.
- MMF/Deposit substitution ratio of 0.2 for every 1.0 point change in deposits.
USCB Financial Holdings, Inc. (USCB) - Porter's Five Forces: Threat of new entrants
You're looking at what it takes for a new player to try and steal market share from USCB Financial Holdings, Inc. (USCB) in South Florida. Honestly, the barriers to entry here are steep, built from regulation, capital needs, and established local trust.
High regulatory barriers require a minimum of $10-$50 million in capital for a community bank. To be more specific based on 2025 estimates for de novo (newly chartered) institutions, regulators often expect initial capital in the range of $20 million-$30 million to satisfy requirements and cover those initial operating losses. Plus, any new community bank opting into the Community Bank Leverage Ratio (CBLR) framework will be watching the proposed rule change from the federal banking agencies, which aims to lower the required ratio from the current 9% to 8% Tier 1 capital to average total consolidated assets, though a new charter like Erebor Bank in October 2025 faced a condition of a minimum 12% Tier 1 leverage ratio for its first three years. That's a lot of cash just to get the doors open.
New banks must overcome the FDIC insurance and trust barrier. This isn't just about paperwork; it's about customer confidence. When you're handling people's money, trust is your most valuable, non-tangible asset. For a new institution, building that credibility against established names takes time and significant marketing spend, which ties directly into customer acquisition costs.
USCB Financial Holdings, Inc.'s established local presence is definitely a strong barrier. As one of the largest community banks headquartered in the Miami-Dade metro area, USCB Financial Holdings, Inc. currently operates through a network of 10 banking centers across South Florida. That physical footprint, combined with its 5-Star rating from BauerFinancial, means a new entrant has to compete against established convenience and proven stability.
Fintech entrants can bypass branch costs but face high customer acquisition costs. While a digital-only bank avoids the real estate expense of those 10 banking centers, they run headfirst into the cost of earning a customer's trust digitally. Industry benchmarks for 2025 put the average Customer Acquisition Cost (CAC) in fintech at $1,450 per customer. For enterprise-focused financial solutions, that cost can skyrocket to around $14,772 per customer. Still, if a fintech can nail personalization, they might see CAC reductions of 10%-30%, so it's not an insurmountable wall, just an expensive one to climb.
Here's a quick look at the financial hurdles new entrants face compared to USCB Financial Holdings, Inc.'s existing scale:
| Barrier Component | Metric/Requirement | Data Point (2025) |
|---|---|---|
| Initial Regulatory Capital | Estimated Minimum Capital for New Charter | $20 million-$30 million |
| Regulatory Capital Ratio (Proposed) | Lower Bound for Qualifying CBLR | 8% |
| USCB Established Presence | Number of South Florida Banking Centers | 10 |
| Fintech Customer Acquisition Cost | Average Consumer Fintech CAC | $1,450 |
| Fintech Customer Acquisition Cost | Enterprise Fintech CAC | Up to $14,772 |
The regulatory environment itself is complex, as evidenced by the recent proposal to lower the CBLR from 9% to 8%, which signals a focus on capital adequacy even while trying to ease burdens on existing community banks like USCB Financial Holdings, Inc.
You've got to factor in the trust deficit. For example, 73% of expensive new fintech users reportedly abandon an app within the first week, which highlights the premium new entrants must pay to overcome the inherent trust USCB Financial Holdings, Inc. already holds with its local base.
Finance: draft the sensitivity analysis on the impact of a $5 million increase in initial capital requirement by next Tuesday.
Disclaimer
All information, articles, and product details provided on this website are for general informational and educational purposes only. We do not claim any ownership over, nor do we intend to infringe upon, any trademarks, copyrights, logos, brand names, or other intellectual property mentioned or depicted on this site. Such intellectual property remains the property of its respective owners, and any references here are made solely for identification or informational purposes, without implying any affiliation, endorsement, or partnership.
We make no representations or warranties, express or implied, regarding the accuracy, completeness, or suitability of any content or products presented. Nothing on this website should be construed as legal, tax, investment, financial, medical, or other professional advice. In addition, no part of this site—including articles or product references—constitutes a solicitation, recommendation, endorsement, advertisement, or offer to buy or sell any securities, franchises, or other financial instruments, particularly in jurisdictions where such activity would be unlawful.
All content is of a general nature and may not address the specific circumstances of any individual or entity. It is not a substitute for professional advice or services. Any actions you take based on the information provided here are strictly at your own risk. You accept full responsibility for any decisions or outcomes arising from your use of this website and agree to release us from any liability in connection with your use of, or reliance upon, the content or products found herein.