
|
Utah Medical Products, Inc. (UTMD) DCF Valuation |
Fully Editable: Tailor To Your Needs In Excel Or Sheets
Professional Design: Trusted, Industry-Standard Templates
Investor-Approved Valuation Models
MAC/PC Compatible, Fully Unlocked
No Expertise Is Needed; Easy To Follow
Utah Medical Products, Inc. (UTMD) Bundle
Discover the true potential of Utah Medical Products, Inc. (UTMD) with our advanced DCF Calculator! Adjust key assumptions, explore various scenarios, and evaluate how changes affect Utah Medical Products, Inc. (UTMD) valuation – all in one convenient Excel template.
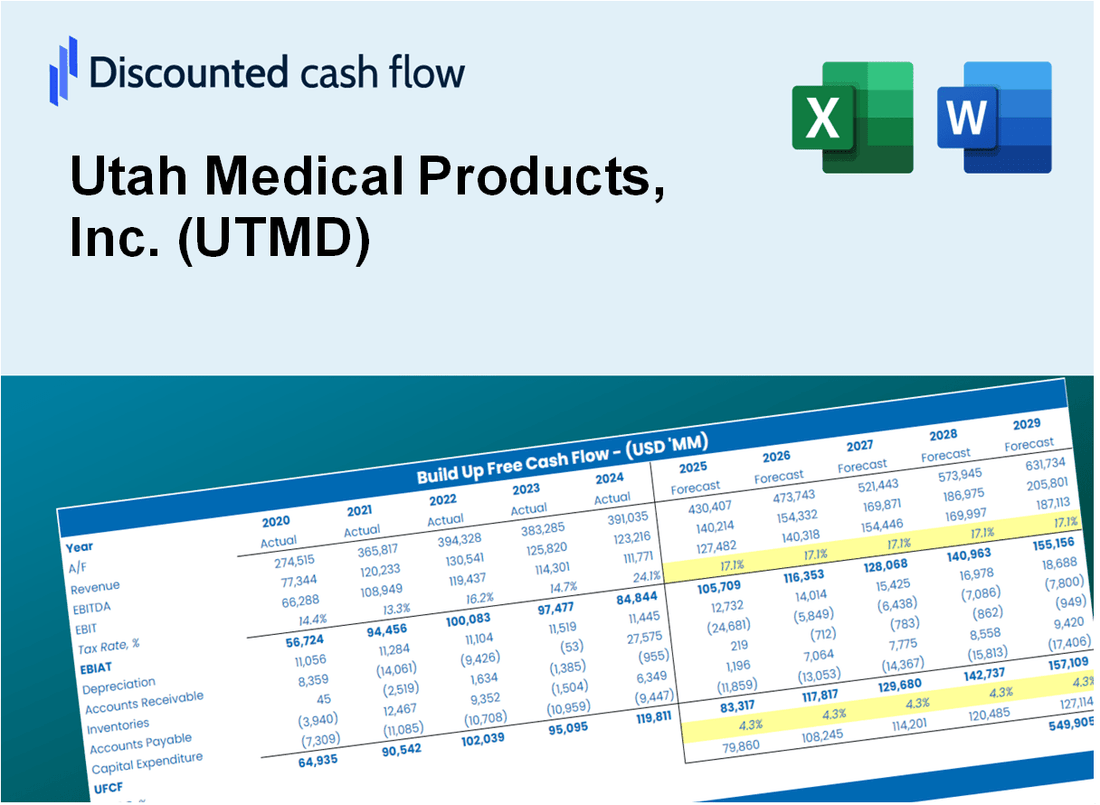
Discounted Cash Flow (DCF) - (USD MM)
| Year | AY1 2020 |
AY2 2021 |
AY3 2022 |
AY4 2023 |
AY5 2024 |
FY1 2025 |
FY2 2026 |
FY3 2027 |
FY4 2028 |
FY5 2029 |
|---|---|---|---|---|---|---|---|---|---|---|
| Revenue | 42.2 | 49.1 | 52.3 | 50.2 | 40.9 | 40.9 | 41.0 | 41.0 | 41.1 | 41.1 |
| Revenue Growth, % | 0 | 16.3 | 6.58 | -3.93 | -18.56 | 0.09685955 | 0.09685955 | 0.09685955 | 0.09685955 | 0.09685955 |
| EBITDA | 20.9 | 26.2 | 26.9 | 24.8 | 16.4 | 20.0 | 20.0 | 20.0 | 20.0 | 20.0 |
| EBITDA, % | 49.59 | 53.34 | 51.4 | 49.28 | 40.19 | 48.76 | 48.76 | 48.76 | 48.76 | 48.76 |
| Depreciation | 7.2 | 7.3 | 7.1 | 6.4 | 2.8 | 5.3 | 5.3 | 5.3 | 5.3 | 5.3 |
| Depreciation, % | 17.09 | 14.85 | 13.55 | 12.68 | 6.77 | 12.99 | 12.99 | 12.99 | 12.99 | 12.99 |
| EBIT | 13.7 | 18.9 | 19.8 | 18.4 | 13.7 | 14.6 | 14.7 | 14.7 | 14.7 | 14.7 |
| EBIT, % | 32.5 | 38.49 | 37.85 | 36.6 | 33.42 | 35.77 | 35.77 | 35.77 | 35.77 | 35.77 |
| Total Cash | 51.6 | 61.0 | 75.1 | 92.9 | 83.0 | 40.9 | 41.0 | 41.0 | 41.1 | 41.1 |
| Total Cash, percent | .0 | .0 | .0 | .0 | .0 | .0 | .0 | .0 | .0 | .0 |
| Account Receivables | 4.1 | 5.1 | 5.5 | 3.3 | 4.1 | 3.9 | 3.9 | 3.9 | 3.9 | 3.9 |
| Account Receivables, % | 9.73 | 10.46 | 10.59 | 6.65 | 10.01 | 9.49 | 9.49 | 9.49 | 9.49 | 9.49 |
| Inventories | 6.2 | 6.6 | 8.8 | 9.6 | 8.8 | 7.0 | 7.0 | 7.0 | 7.0 | 7.0 |
| Inventories, % | 14.75 | 13.45 | 16.86 | 19.08 | 21.54 | 17.14 | 17.14 | 17.14 | 17.14 | 17.14 |
| Accounts Payable | .8 | .8 | 1.2 | .8 | .5 | .7 | .7 | .7 | .7 | .7 |
| Accounts Payable, % | 1.87 | 1.55 | 2.33 | 1.53 | 1.33 | 1.72 | 1.72 | 1.72 | 1.72 | 1.72 |
| Capital Expenditure | -.9 | -.6 | -.8 | -.6 | -.2 | -.5 | -.5 | -.5 | -.5 | -.5 |
| Capital Expenditure, % | -2.04 | -1.13 | -1.56 | -1.27 | -0.57453 | -1.32 | -1.32 | -1.32 | -1.32 | -1.32 |
| Tax Rate, % | 17.43 | 17.43 | 17.43 | 17.43 | 17.43 | 17.43 | 17.43 | 17.43 | 17.43 | 17.43 |
| EBITAT | 10.7 | 14.6 | 15.8 | 15.2 | 11.3 | 11.7 | 11.7 | 11.8 | 11.8 | 11.8 |
| Depreciation | ||||||||||
| Changes in Account Receivables | ||||||||||
| Changes in Inventories | ||||||||||
| Changes in Accounts Payable | ||||||||||
| Capital Expenditure | ||||||||||
| UFCF | 7.5 | 20.0 | 19.9 | 21.9 | 13.6 | 18.7 | 16.5 | 16.5 | 16.6 | 16.6 |
| WACC, % | 5.11 | 5.11 | 5.11 | 5.11 | 5.11 | 5.11 | 5.11 | 5.11 | 5.11 | 5.11 |
| PV UFCF | ||||||||||
| SUM PV UFCF | 73.5 | |||||||||
| Long Term Growth Rate, % | 0.50 | |||||||||
| Free cash flow (T + 1) | 17 | |||||||||
| Terminal Value | 361 | |||||||||
| Present Terminal Value | 281 | |||||||||
| Enterprise Value | 355 | |||||||||
| Net Debt | -83 | |||||||||
| Equity Value | 438 | |||||||||
| Diluted Shares Outstanding, MM | 4 | |||||||||
| Equity Value Per Share | 124.93 |
What You Will Receive
- Customizable Excel Template: A fully editable Excel-based DCF Calculator featuring pre-filled real UTMD financials.
- Accurate Data: Historical performance data and forward-looking projections (highlighted in the yellow cells).
- Assumption Flexibility: Modify forecast parameters such as revenue growth, EBITDA %, and WACC.
- Instant Calculations: Quickly observe how your inputs influence Utah Medical Products' valuation.
- Professional Resource: Designed for investors, CFOs, consultants, and financial analysts.
- User-Friendly Interface: Organized for clarity and ease of navigation, complete with step-by-step guidance.
Key Features
- Customizable Financial Metrics: Adjust essential parameters such as revenue growth, profit margins, and R&D investments.
- Instant DCF Valuation: Automatically computes intrinsic value, NPV, and other financial metrics with ease.
- High-Precision Accuracy: Leverages Utah Medical Products, Inc.'s (UTMD) actual financial data for credible valuation results.
- Effortless Scenario Testing: Evaluate various assumptions and analyze results without complications.
- Efficiency Booster: Streamline the valuation process and avoid the hassle of constructing intricate models from the ground up.
How It Works
- 1. Access the Template: Download and open the Excel file containing Utah Medical Products, Inc.'s (UTMD) preloaded data.
- 2. Modify Assumptions: Adjust key inputs such as growth rates, WACC, and capital expenditures to fit your analysis.
- 3. Review Results Instantly: The DCF model automatically computes intrinsic value and NPV based on your inputs.
- 4. Explore Scenarios: Evaluate various forecasts to assess different valuation possibilities.
- 5. Present with Confidence: Deliver professional valuation insights to enhance your decision-making process.
Why Choose Utah Medical Products, Inc. (UTMD)?
- Time Efficiency: Quickly access essential medical product insights without extensive research.
- Enhanced Precision: Dependable data and methodologies minimize inaccuracies in your assessments.
- Completely Adaptable: Adjust the tools to align with your specific needs and forecasts.
- User-Friendly: Intuitive interfaces and visual representations simplify the interpretation of results.
- Endorsed by Professionals: Crafted for industry experts who prioritize accuracy and functionality.
Who Should Use This Product?
- Investors: Accurately estimate Utah Medical Products, Inc.'s (UTMD) fair value before making investment decisions.
- CFOs: Utilize a professional-grade DCF model for financial reporting and analysis specific to Utah Medical Products, Inc. (UTMD).
- Consultants: Quickly adapt the template for valuation reports tailored to clients in the medical sector.
- Entrepreneurs: Gain insights into financial modeling practices used by leading medical device companies.
- Educators: Use it as a teaching tool to demonstrate valuation methodologies in the healthcare industry.
What the Template Contains
- Preloaded UTMD Data: Historical and projected financial data, including revenue, EBIT, and capital expenditures.
- DCF and WACC Models: Professional-grade sheets for calculating intrinsic value and Weighted Average Cost of Capital.
- Editable Inputs: Yellow-highlighted cells for adjusting revenue growth, tax rates, and discount rates.
- Financial Statements: Comprehensive annual and quarterly financials for deeper analysis.
- Key Ratios: Profitability, leverage, and efficiency ratios to evaluate performance.
- Dashboard and Charts: Visual summaries of valuation outcomes and assumptions.
Disclaimer
All information, articles, and product details provided on this website are for general informational and educational purposes only. We do not claim any ownership over, nor do we intend to infringe upon, any trademarks, copyrights, logos, brand names, or other intellectual property mentioned or depicted on this site. Such intellectual property remains the property of its respective owners, and any references here are made solely for identification or informational purposes, without implying any affiliation, endorsement, or partnership.
We make no representations or warranties, express or implied, regarding the accuracy, completeness, or suitability of any content or products presented. Nothing on this website should be construed as legal, tax, investment, financial, medical, or other professional advice. In addition, no part of this site—including articles or product references—constitutes a solicitation, recommendation, endorsement, advertisement, or offer to buy or sell any securities, franchises, or other financial instruments, particularly in jurisdictions where such activity would be unlawful.
All content is of a general nature and may not address the specific circumstances of any individual or entity. It is not a substitute for professional advice or services. Any actions you take based on the information provided here are strictly at your own risk. You accept full responsibility for any decisions or outcomes arising from your use of this website and agree to release us from any liability in connection with your use of, or reliance upon, the content or products found herein.