
|
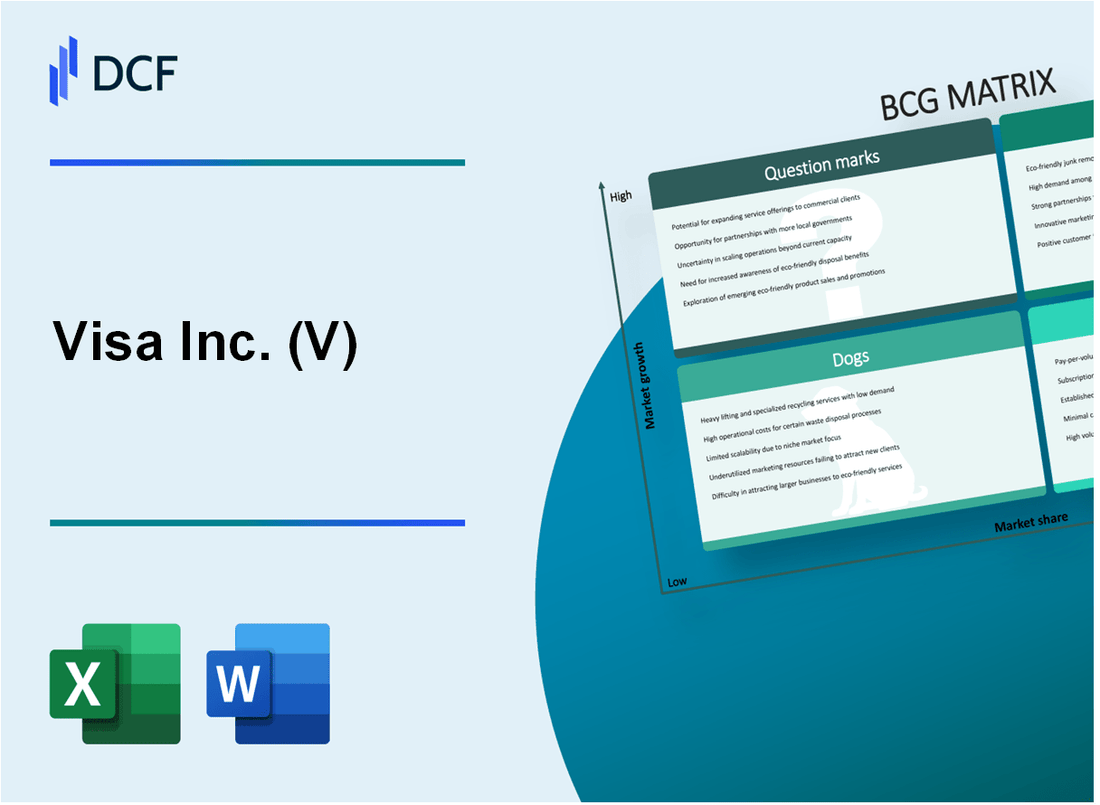
Visa Inc. (V): BCG Matrix [Apr-2026 Updated] |
Fully Editable: Tailor To Your Needs In Excel Or Sheets
Professional Design: Trusted, Industry-Standard Templates
Investor-Approved Valuation Models
MAC/PC Compatible, Fully Unlocked
No Expertise Is Needed; Easy To Follow
Visa Inc. (V) Bundle
You're looking for a clear, no-nonsense breakdown of Visa Inc.'s business lines as of late 2025, mapping their dominance and growth potential using the classic BCG Matrix. Honestly, the picture shows a powerhouse funding its future: core Service Revenue is a reliable $17.5 billion grower, yet the company is pouring resources into Question Marks like Visa Direct, which is spiking 28% to 34% in transaction growth, while simultaneously defending its 90% e-commerce processing share. We've mapped out exactly where Visa Inc.'s 76% contactless adoption sits against its legacy, low-margin domestic segments. Keep reading to see which units are the dependable Cash Cows and which are the high-stakes Stars you need to watch.
Background of Visa Inc. (V)
You're looking at Visa Inc. (V) as of late 2025, and honestly, the numbers coming out of their Fiscal Year 2025 report-which ended around September 30, 2025-show a company that remains a powerhouse in global finance. Visa is an American multinational payments technology company, headquartered in San Francisco, California, that facilitates electronic funds transfers worldwide. Its core mission is to connect the world through a payments network that is innovative, convenient, reliable, and secure, helping individuals, businesses, and economies thrive.
To be clear about what Visa does, it doesn't issue cards or extend credit; that's the job of the financial institutions that partner with them. Instead, Visa acts as the critical intermediary, providing the secure and efficient processing backbone, known as VisaNet, that connects consumers, sellers, and those issuing and acquiring financial institutions across more than 200 countries and territories.
The financial performance for the full Fiscal Year 2025 was strong, showing the durability of its model. Net Revenue for the year hit $40.0 billion, which was an 11% increase over the prior year, or 12% growth when viewed on a constant-dollar basis. On the profitability side, Non-GAAP Net Income reached $22.5 billion, translating to a Non-GAAP Diluted Earnings Per Share (EPS) of $11.47.
Operationally, the network processed a massive 257.5 billion transactions in FY 2025. Visa maintains a dominant position in the global payments landscape. Excluding the domestic Chinese market, Visa holds about a 50% market share of total card payments globally, and in the U.S. card network sector specifically, it commands a 52% share.
The company is actively diversifying its revenue streams beyond traditional consumer payments. Its growth is now fueled by three main levers: Consumer Payments, New Flows, and Value-Added Services (VAS). International business is a huge part of this, with international net revenue now making up almost 60% of Visa's total net revenue. For instance, Visa Direct, a key part of their New Flows strategy, handled nearly 10 billion transactions in 2024.
In terms of capital deployment, Visa returned significant cash to shareholders in FY 2025. The board approved a 14% increase to the quarterly cash dividend. Furthermore, the company repurchased $18.2 billion worth of its class A common stock during the fiscal year.
Visa Inc. (V) - BCG Matrix: Stars
You're analyzing Visa Inc.'s portfolio right now, looking to see where the future cash flow engines are being built. The Stars quadrant is where high market share meets high market growth, demanding heavy investment to maintain leadership. For Visa Inc., these areas are characterized by massive transaction volumes and rapid adoption of new payment methods.
The key metrics defining these Stars for Visa Inc. as of 2025 show dominant positions in several high-growth segments. These units are leaders today but require significant capital to fend off competition and scale infrastructure to meet soaring demand.
Here's a look at the specific business units qualifying as Stars:
- Cross-Border Volume: Growth remains strong, driven by global travel rebound.
- Value-Added Services (VAS): Revenue growth is accelerating as services like fraud and risk management become essential.
- Tap-to-Pay/Contactless Solutions: Consumer preference is driving near-ubiquitous adoption globally.
- E-commerce Payment Processing: Visa Inc. maintains near-monopoly status in online transaction processing.
These Stars are the core of Visa Inc.'s future Cash Cows, provided the company keeps investing aggressively to sustain this market share while the underlying markets continue to expand rapidly.
Cross-Border Volume
Cross-Border Volume is definitely a Star because of the sustained global travel and digital trade recovery. This segment generates high-margin international transaction revenue for Visa Inc. In the third quarter of fiscal year 2025, total cross-border volume increased by 12% on a constant currency basis year-over-year. If you look specifically at cross-border volume excluding transactions within Europe, the growth was 11% in constant dollars for Q3 2025. Cross-border e-commerce specifically saw a rise of 13% in that same quarter. This strength directly fueled International Transaction Revenue, which climbed 14% year-over-year to $3.6 billion in Q3 2025.
Value-Added Services (VAS)
Value-Added Services, which include fraud, risk, and consulting tools, are a high-growth area for Visa Inc. For the full fiscal year 2025, Value-Added Services revenue grew 23% on a constant dollar basis. In the fourth quarter of 2025, VAS revenue expanded 25% in constant dollars, reaching $3 billion. To give you context on the revenue mix, the 'Other revenue' category, which is driven by these services, grew 32% year-over-year in Q3 2025. This segment is now approaching 30% of Visa Inc.'s total net revenues, up from around 20% a few years ago. The potential opportunity here is massive, estimated by the company to be a $520 billion annual revenue opportunity.
Here are the key financial figures for the growth engines:
| Metric | Growth Rate (Constant Dollars) | Reported Value (Latest Quarter/FY) |
| Full Year FY 2025 VAS Revenue Growth | 23% | N/A |
| Q4 2025 VAS Revenue Growth | 25% | $3 billion |
| Q3 2025 Other Revenue Growth (Includes VAS) | 32% | N/A |
Tap-to-Pay/Contactless Solutions
Contactless adoption is a clear Star because of its high penetration in a market that is still growing. As of 2025, 76% of all Visa card payments globally were contactless. Furthermore, Tap to Phone technology, which turns a smartphone into a point-of-sale device, experienced a 200% year-over-year increase in adoption over the past year, supporting millions of sellers. In the third quarter of 2025, Visa Inc. reported that Tap to Pay penetration reached 78% of face-to-face transactions globally. This is a defintely a high-growth area you need to watch.
E-commerce Payment Processing
Visa Inc. maintains a near-monopoly position in the rapidly expanding e-commerce sector. In 2025, Visa Inc.'s payment solutions accounted for 90% of all online transactions. This dominance is supported by the issuance of 13.7 billion tokens globally, with 50% of all e-commerce transactions now tokenized for security. The company is actively investing in this space, having put $3.3 billion into AI and data infrastructure to enhance fraud detection and payment experiences.
You should track these specific technology adoption numbers:
- Global Contactless Card Payments (2025): 76% of all payments.
- Global Face-to-Face Contactless Penetration (Q3 2025): 78%.
- E-commerce Transactions Processed by Visa (2025): 90% share.
- Total Visa Tokens Issued (as of April 2025): 13.7 billion.
Finance: draft 13-week cash view by Friday.
Visa Inc. (V) - BCG Matrix: Cash Cows
Cash Cows for Visa Inc. (V) are those business units operating in mature, low-growth segments but commanding a high market share, thereby generating substantial, reliable cash flow that fuels the rest of the enterprise. These are the core, highly profitable engines of the company.
The Core Data Processing Revenue segment exemplifies this status. For the fiscal year 2025, this segment was the largest contributor, generating $20.0 billion in revenue. This figure represents a steady 13% year-over-year growth, demonstrating the consistent demand for Visa's authorization, clearing, and settlement services. This segment's high market share in a mature processing environment translates directly into high-margin cash generation.
The Service Revenue stream is another pillar of the Cash Cow quadrant. This revenue, derived from fees based on prior period payment volumes, hit $17.5 billion in fiscal year 2025. This was a reliable 9% growth, supported by the massive, mature card base. As of the latest data, Visa supports approximately 4.7 billion credentials globally, providing a vast, stable foundation for recurring service fee collection.
You can see the scale of these core segments in the table below, which highlights their financial contribution for the full fiscal year 2025:
| Revenue Segment | FY 2025 Revenue (USD) | Year-over-Year Growth |
|---|---|---|
| Core Data Processing Revenue | $20.0 billion | 13% |
| Service Revenue | $17.5 billion | 9% |
The underlying strength is the Global Network Infrastructure (VisaNet). This infrastructure provides a high-margin, defensible moat, with its global market share in transaction processing exceeding 60%. This dominance means that for nearly every digital transaction outside of China's domestic network, Visa is the established, trusted intermediary, requiring minimal incremental promotional spend to maintain volume.
Furthermore, the domestic position remains unassailable, which is key for a Cash Cow. The U.S. Consumer Payments Network commands a dominant 52% market share in the U.S. card network sector. This high penetration in the world's largest consumer market ensures consistent, high-volume transaction flow.
The operational efficiency derived from this mature position allows Visa to focus on milking these gains passively while funding riskier ventures. Key characteristics supporting this Cash Cow status include:
- High Profitability: Operating margin remained strong at approximately 61% as of the trailing twelve months ending September 2025.
- Cash Generation: Free cash flow for the trailing twelve months stood at $14.75 billion (as of Q2 2025 context).
- Shareholder Return: The board increased the quarterly cash dividend by 14% to $0.670 per share for the fiscal year 2025.
- Scale of Operations: Total processed transactions for the full fiscal year 2025 reached 257.5 billion.
Visa Inc. (V) - BCG Matrix: Dogs
You're analyzing Visa Inc.'s portfolio and see that some legacy areas, while still processing volume, aren't driving the high-growth story you see elsewhere. These are the Dogs-units in slow-growth markets with low relative share, which we want to minimize or divest unless they serve a critical, non-financial purpose. They tie up capital that could fuel Stars or Question Marks.
Legacy Domestic Card-Present Transactions represent the most mature part of Visa Inc.'s core business. While the overall U.S. payment volume is still growing, it is slower than international or digital flows. For the full year 2025, U.S. Visa card transaction value growth was reported at $\text{7\%}$. This is a clear indicator of market saturation compared to the double-digit growth seen in cross-border or value-added services segments.
The pressure on margins in this segment is real. You know that a recent interchange fee settlement in late 2025 caps certain credit card fees, which could potentially reduce network volumes in the U.S. retail sector. This regulatory environment makes expensive turnaround plans for this segment generally unadvisable; the focus should be on efficiency and harvesting.
Here's a look at the mature domestic debit space, where margins are tight:
- Total Visa cards in circulation globally as of 2025: $\text{4.7}$ billion.
- Visa debit cards account for approximately $\text{1.012}$ billion of that total.
- U.S. payments volume growth in Q2 2025 was $\text{6\%}$ year-over-year.
- U.S. credit volume growth in Q2 2025 was $\text{7\%}$ year-over-year.
- U.S. debit volume growth in Q2 2025 was $\text{8\%}$ year-over-year.
Low-Value, Domestic Debit Card Interchange falls into this Dog category because, despite high volume, the per-transaction revenue is low and heavily regulated. The interchange reimbursement fees are transfer fees between financial institutions, and the low-margin nature makes them cash-neutral or even cash-negative if compliance costs rise. We see specific fee structures that reflect this low-value, regulated environment, such as the rates effective October 18, 2025, for U.S. transactions:
| Fee Program (Card Present) | Exempt Visa Check Card | Regulated Visa Check Card |
|---|---|---|
| CPS/Supermarket, Debit | $\text{0.30\%}$ | $\text{0.05\%} + \$0.21$ |
| CPS/Retail, Debit | $\text{0.80\%} + \$0.15$ | $\text{0.05\%} + \$0.21$ |
| CPS/Automated Fuel Dispenser (AFD), Debit | $\text{0.80\%} + \$0.15$ | $\text{0.05\%} + \$0.21$ |
Specific Regional or Local Payment Schemes where Visa Inc. has minimal share and growth is stagnant are classic Dogs. These are often areas where a strong domestic player or a government-backed rail has entrenched itself, making incremental investment unlikely to yield a Star. While Visa's overall international transaction revenue grew $\text{10\%}$ in Q2 2025, this is driven by high-growth emerging markets like Latin America ($\text{22\%}$ YoY growth in Q1 2025). The Dog component would be the specific, non-performing regional schemes that lag this average significantly, perhaps showing growth below the $\text{1\%}$ seen in the Asia-Pacific region in Q1 2025.
Finally, Non-Digital, Paper-Based Payment Support is actively being displaced. This category includes legacy processing or support for methods that are being replaced by digital solutions like tokenization, which provisioned $\text{11.5}$ billion network tokens as of the end of FY24. The revenue from these legacy support functions is likely declining, representing a low-growth, low-share area that consumes operational capacity without contributing meaningfully to the $\text{26\%}$ growth seen in Value-Added Services revenue in Q3 2025.
- Value-Added Services (VAS) revenue growth (constant dollars, Q3 2025): $\text{26\%}$.
- Visa Direct transaction growth (YoY): $\text{38\%}$.
- Total Processed Transactions (FY 2025): $\text{257.5}$ billion.
- Total Processed Transactions (FY 2024): $\text{233.8}$ billion.
Visa Inc. (V) - BCG Matrix: Question Marks
These business areas for Visa Inc. are characterized by operating in high-growth markets but currently hold a relatively low market share, demanding significant cash investment to capture future potential.
Visa Direct (Real-Time Payments)
Visa Direct is operating in the rapidly expanding real-time payments and person-to-person (P2P) remittance space. The growth trajectory is strong, but the market is highly fragmented and competitive, meaning share gains require continuous, heavy investment.
For the fiscal second quarter of 2025, Visa Direct transactions showed a year-over-year increase of 28% in constant dollars. Visa Direct transactions reached 3 billion transactions in that quarter. By the third quarter of 2025, transaction growth remained robust at 25% year-over-year, with the total volume reaching 3.3 billion transactions. This segment's revenue growth in the third quarter of 2025 was 13% year-over-year in constant dollars, which is a lower percentage than the transaction growth, suggesting pricing pressure or a shift in the mix of transactions.
You need to watch the market share capture here; high transaction growth is necessary to avoid this unit becoming a Dog.
Business-to-Business (B2B) Payments
The Commercial and Money Movement Solutions (CMS) segment targets the massive opportunity in commercial payments. While the overall volume growth is positive, it is lower than the core consumer segments, reflecting the slower, more complex nature of enterprise adoption.
In the third quarter of 2025, commercial payments volume grew 7% year-over-year in constant dollars. CMS revenue for the same period rose 13% year-over-year in constant dollars, indicating that value-added services and pricing within the commercial space are helping to accelerate revenue growth beyond just volume.
The strategy here is to build share in a huge, often paper-based, market. Success depends on embedding Visa into the day-to-day operations of businesses, which is a long-term cash commitment.
Stablecoin and Crypto Initiatives
This area represents a high-risk, high-reward bet on the future of settlement layers. Visa Inc. is integrating digital currencies to ensure relevance regardless of which technology dominates, but the path to scalable, profitable monetization is still being defined by regulatory clarity and consumer adoption.
Visa has chosen absorption over resistance, integrating digital currencies into its stack to turn disruption into learning and long-term positioning. Key metrics showing current scale include:
- Total crypto and stablecoin flows handled since 2020: more than $140 billion.
- Flows tied to user purchases since 2020: more than $100 billion.
- Number of stablecoin-linked card programs operating on Visa: Over 130.
- Countries where these programs operate: More than 40.
A previous pilot program for USD Coin (USDC) settlements processed over $2.5 billion in annualized volume.
Open Banking Solutions (e.g., Tink Acquisition)
The investment in European open banking, primarily through the acquisition of Tink, requires substantial ongoing investment in a fragmented, regulation-heavy market. The goal is to create a secure, reliable platform for innovation that complements Visa's core network.
The initial investment to acquire Tink was reported as a $2.2 billion deal, or approximately €1.80B. Tink is integrated with more than 3,400 banks and financial institutions across Europe. The combination aims to accelerate open banking adoption globally.
Here is a comparison of the key investment areas classified as Question Marks:
| Business Unit | Key Growth Metric (2025) | Value/Amount | Context |
| Visa Direct | Transaction Growth (Q2 2025) | 28% | Year-over-year in constant dollars |
| Visa Direct | Total Transactions (Q3 2025) | 3.3 billion | Year-over-year growth of 25% |
| B2B Payments (CMS) | Commercial Payments Volume Growth (Q3 2025) | 7% | Year-over-year in constant dollars |
| Stablecoin/Crypto | Total Flows Since 2020 | $140 billion | Including over $100 billion tied to user purchases |
| Stablecoin/Crypto | Card Programs | Over 130 | Operating across more than 40 countries |
| Open Banking (Tink) | Acquisition Cost | $2.2 billion | Original deal value |
These units consume cash now, hoping to quickly build market share to transition into Stars.
Disclaimer
All information, articles, and product details provided on this website are for general informational and educational purposes only. We do not claim any ownership over, nor do we intend to infringe upon, any trademarks, copyrights, logos, brand names, or other intellectual property mentioned or depicted on this site. Such intellectual property remains the property of its respective owners, and any references here are made solely for identification or informational purposes, without implying any affiliation, endorsement, or partnership.
We make no representations or warranties, express or implied, regarding the accuracy, completeness, or suitability of any content or products presented. Nothing on this website should be construed as legal, tax, investment, financial, medical, or other professional advice. In addition, no part of this site—including articles or product references—constitutes a solicitation, recommendation, endorsement, advertisement, or offer to buy or sell any securities, franchises, or other financial instruments, particularly in jurisdictions where such activity would be unlawful.
All content is of a general nature and may not address the specific circumstances of any individual or entity. It is not a substitute for professional advice or services. Any actions you take based on the information provided here are strictly at your own risk. You accept full responsibility for any decisions or outcomes arising from your use of this website and agree to release us from any liability in connection with your use of, or reliance upon, the content or products found herein.