
|
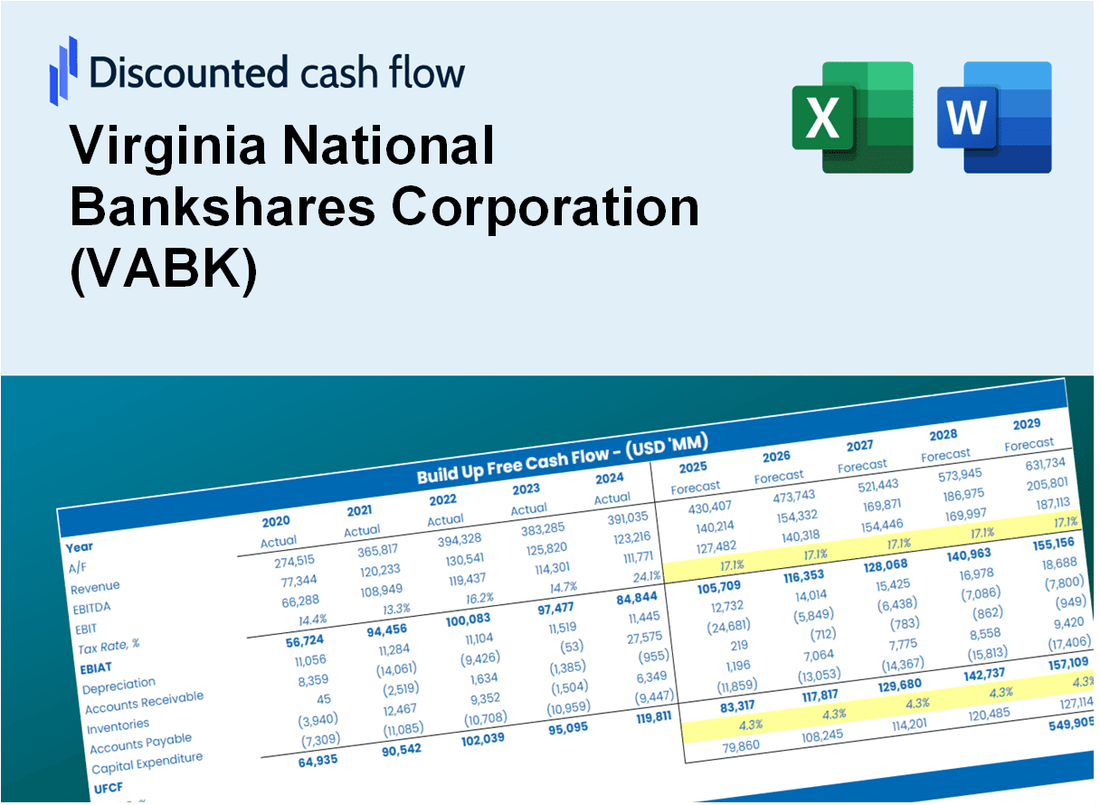
Virginia National Bankshares Corporation (VABK) DCF Valuation |
Fully Editable: Tailor To Your Needs In Excel Or Sheets
Professional Design: Trusted, Industry-Standard Templates
Investor-Approved Valuation Models
MAC/PC Compatible, Fully Unlocked
No Expertise Is Needed; Easy To Follow
Virginia National Bankshares Corporation (VABK) Bundle
Designed for accuracy, our (VABK) DCF Calculator empowers you to evaluate the valuation of Virginia National Bankshares Corporation using actual financial data and provides comprehensive flexibility to modify all essential parameters for improved projections.
What You Will Receive
- Pre-Filled Financial Model: Virginia National Bankshares Corporation’s actual data facilitates accurate DCF valuation.
- Comprehensive Forecast Control: Modify revenue growth, profit margins, WACC, and other essential metrics.
- Real-Time Calculations: Automatic updates provide immediate feedback as you adjust parameters.
- Professional-Grade Template: A polished Excel file crafted for high-quality valuation.
- Flexible and Reusable: Designed for adaptability, enabling multiple uses for in-depth forecasts.
Key Features
- 🔍 Real-Life VABK Financials: Pre-filled historical and projected data for Virginia National Bankshares Corporation (VABK).
- ✏️ Fully Customizable Inputs: Adjust all critical parameters (yellow cells) like WACC, growth %, and tax rates.
- 📊 Professional DCF Valuation: Built-in formulas calculate Virginia National Bankshares Corporation’s intrinsic value using the Discounted Cash Flow method.
- ⚡ Instant Results: Visualize Virginia National Bankshares Corporation’s valuation instantly after making changes.
- Scenario Analysis: Test and compare outcomes for various financial assumptions side-by-side.
How It Works
- 1. Access the Template: Download and open the Excel file featuring Virginia National Bankshares Corporation’s (VABK) preloaded data.
- 2. Adjust Assumptions: Modify essential inputs such as growth rates, WACC, and capital expenditures.
- 3. View Results Instantly: The DCF model automatically calculates the intrinsic value and NPV for you.
- 4. Explore Scenarios: Evaluate various forecasts to understand different valuation results.
- 5. Present with Assurance: Share professional valuation insights to back your financial decisions.
Why Choose This Calculator for Virginia National Bankshares Corporation (VABK)?
- User-Friendly Interface: Perfect for both novice users and seasoned professionals.
- Customizable Inputs: Adjust parameters to tailor your financial analysis.
- Real-Time Insights: Watch Virginia National Bankshares Corporation’s valuation update instantly as you make changes.
- Pre-Loaded Data: Comes with Virginia National Bankshares Corporation’s latest financial metrics for immediate use.
- Relied Upon by Experts: A go-to tool for investors and analysts seeking to make educated decisions.
Who Should Use This Product?
- Professional Investors: Develop comprehensive and trustworthy valuation models for portfolio management focused on Virginia National Bankshares Corporation (VABK).
- Corporate Finance Teams: Evaluate valuation scenarios to inform strategic decisions within their organizations.
- Consultants and Advisors: Deliver precise valuation insights for clients interested in Virginia National Bankshares Corporation (VABK).
- Students and Educators: Utilize real-world data to enhance learning and practice in financial modeling.
- Banking Enthusiasts: Gain insights into how regional banks like Virginia National Bankshares Corporation (VABK) are valued in the financial market.
What the Template Contains
- Preloaded VABK Data: Historical and projected financial data, including revenue, EBIT, and capital expenditures.
- DCF and WACC Models: Professional-grade sheets for calculating intrinsic value and Weighted Average Cost of Capital.
- Editable Inputs: Yellow-highlighted cells for adjusting revenue growth, tax rates, and discount rates.
- Financial Statements: Comprehensive annual and quarterly financials for deeper analysis.
- Key Ratios: Profitability, leverage, and efficiency ratios to evaluate performance.
- Dashboard and Charts: Visual summaries of valuation outcomes and assumptions.
Disclaimer
All information, articles, and product details provided on this website are for general informational and educational purposes only. We do not claim any ownership over, nor do we intend to infringe upon, any trademarks, copyrights, logos, brand names, or other intellectual property mentioned or depicted on this site. Such intellectual property remains the property of its respective owners, and any references here are made solely for identification or informational purposes, without implying any affiliation, endorsement, or partnership.
We make no representations or warranties, express or implied, regarding the accuracy, completeness, or suitability of any content or products presented. Nothing on this website should be construed as legal, tax, investment, financial, medical, or other professional advice. In addition, no part of this site—including articles or product references—constitutes a solicitation, recommendation, endorsement, advertisement, or offer to buy or sell any securities, franchises, or other financial instruments, particularly in jurisdictions where such activity would be unlawful.
All content is of a general nature and may not address the specific circumstances of any individual or entity. It is not a substitute for professional advice or services. Any actions you take based on the information provided here are strictly at your own risk. You accept full responsibility for any decisions or outcomes arising from your use of this website and agree to release us from any liability in connection with your use of, or reliance upon, the content or products found herein.