
|
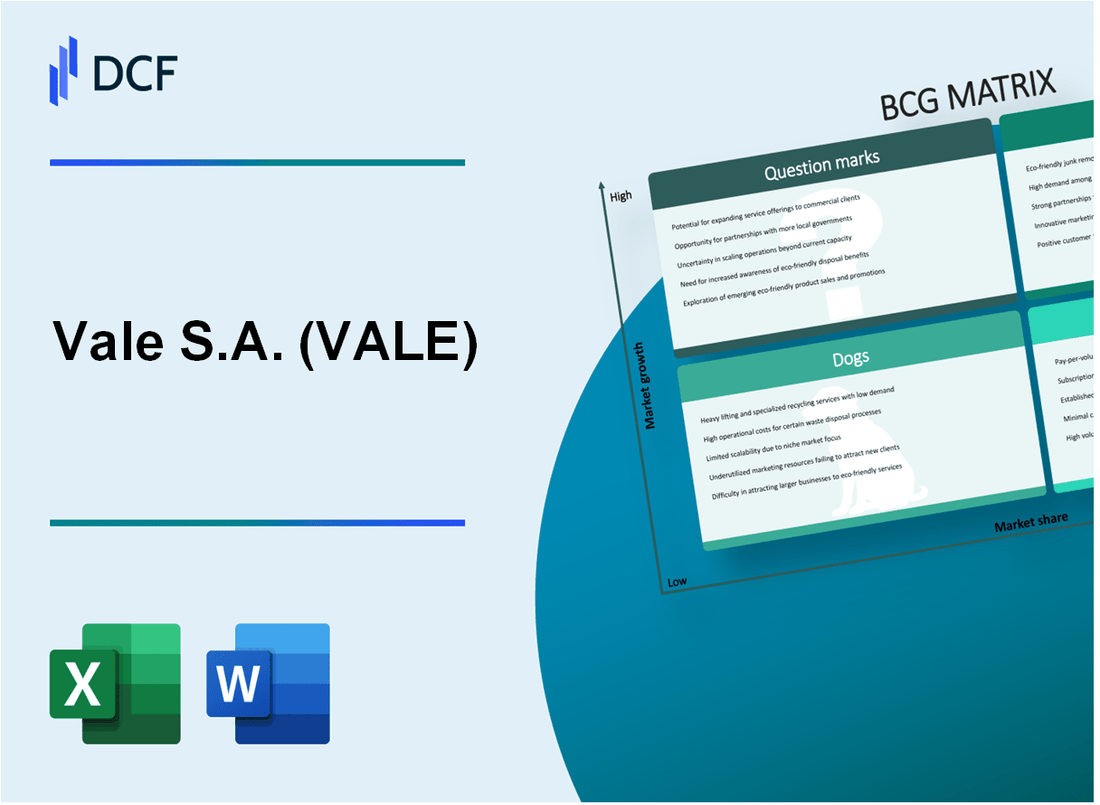
Vale S.A. (VALE): BCG Matrix [Dec-2025 Updated] |
Fully Editable: Tailor To Your Needs In Excel Or Sheets
Professional Design: Trusted, Industry-Standard Templates
Investor-Approved Valuation Models
MAC/PC Compatible, Fully Unlocked
No Expertise Is Needed; Easy To Follow
Vale S.A. (VALE) Bundle
You're looking for the hard truth on Vale S.A.'s portfolio as of late 2025, and honestly, the story is a major strategic pivot away from just being an iron ore giant. Our deep dive using the BCG Matrix shows the bedrock, Iron Ore Solutions, remains a powerful Cash Cow, delivering a 54% Q1 EBITDA margin, but the real growth engine is Copper, our clear Star, with output hitting up to 370,000 tons this year. Still, Nickel is a classic Question Mark, demanding a $1.6 billion bet for 2026 against a volatile market, while non-core assets are being cut as Dogs. Dive in to see exactly where Vale is investing and what it's ready to sell.
Background of Vale S.A. (VALE)
You're looking at a global mining giant, Vale S.A. (VALE), and to map its portfolio using the BCG Matrix, you first need to appreciate its sheer scale and dual focus. Vale S.A. is one of the world's largest producers of iron ore and nickel, but honestly, its portfolio is broader, including manganese, copper, coal, bauxite, and potash. The company was founded way back in 1942 as Companhia Vale do Rio Doce (CVRD) by the Brazilian federal government, and it became the entity we know today after privatization in 1997.
Today, Vale S.A. organizes its operations into two main segments: Iron Solutions and Energy Transition Materials. The Iron Solutions division is the powerhouse, handling the extraction, processing, and sale of iron ore and pellets, plus the critical logistics network to move it. This segment is the backbone; for instance, in the third quarter of 2025, it accounted for roughly 80.8% of the total net operating revenue. The Energy Transition Materials segment focuses on copper and nickel, which are key for things like electric vehicles and renewable infrastructure.
The operational performance in 2025 has been strong, especially on the production front. In Q3 2025, Vale S.A. hit its highest quarterly iron ore production since 2018, shipping 94.4 million metric tons. This operational consistency is helping them manage costs effectively, which is crucial when commodity prices fluctuate. For example, their iron ore fines C1 cash cost (excluding third-party purchases) was only $20.7/t in that quarter, keeping them well within their 2025 guidance range.
Financially, the company is generating serious cash, though it's still managing legacy issues. For the twelve months ending September 30, 2025, total revenue was $37.467 billion, with a gross profit margin of about 34.78%. The recurring Free Cash Flow (FCF) in Q3 2025 alone hit $1.6 billion, which helped chip away at the expanded net debt, bringing it down to $16.6 billion by the end of that quarter. Still, you can't ignore the liabilities; the company is setting aside an additional $500 million provision in its 2025 statements for the Fundão dam breach obligations.
The strategic pivot toward base metals is showing results in cost competitiveness. In Q3 2025, copper all-in costs dropped a massive 65% year-over-year to $994/t, and nickel costs fell 32% year-over-year to $12,347/t. This focus on efficiency across the board supports their capital allocation plan, with the full-year 2025 Capital Expenditure (CapEx) guidance set between $5.4 billion and $5.7 billion, which is smart long-term investing in their core and growth assets.
Vale S.A. (VALE) - BCG Matrix: Stars
You're analyzing Vale S.A.'s portfolio and see that Copper, under the Vale Base Metals segment, clearly fits the Star quadrant. This business unit has a high growth trajectory in a market that desperately needs supply, even though it consumes significant capital to maintain that growth pace.
The production outlook for 2025 shows Vale is on track to meet its guidance. For the full year 2025, Vale S.A. expects copper production to be in the range of 340,000 to 370,000 kt. Honestly, hitting the upper end of that guidance, around 370,000 tonnes of copper by year-end 2025, demonstrates solid operational execution. This is a business unit where Vale is actively investing for the future, planning to double its base metals production capacity to approximately 700,000 tpa by 2035.
The high-growth potential isn't just internal; the external market dynamics are compelling. Electrification across transport, power generation, and industrial processes is creating massive, long-term demand. Projections suggest this transition could require an additional 5 to 7 million additional tonnes of copper annually by 2030. This demand surge, coupled with supply constraints, is what makes the copper market structurally tight, giving Vale's copper assets significant leverage.
Despite the high-growth investment needs, Vale is showing strong cost discipline, which is key for any Star to eventually transition into a Cash Cow. The company has successfully lowered its all-in cost guidance for 2025. Here's the quick math on that cost control:
| Metric | 2025 All-in Cost Guidance (Lowered) | Previous 2025 Guidance |
| Copper (per ton) | US$1,000-US$1,500 | US$1,500-US$2,000 |
This reduction to a range of US$1,000-US$1,500 per ton reflects strong operational performance and favorable by-product credits, like gold priced between US$3,500 to US$4,100 per troy ounce for 4Q25.
To keep this Star shining, Vale is committing capital and strategic partnerships. The focus is clearly on expansion, as the CEO noted, 'No one in this sector has the capacity to increase copper production like we do'.
Key indicators supporting the Star classification for Copper include:
- 2025 Copper Production Guidance: 340,000 to 370,000 kt.
- Projected 2030 Demand Pressure: Electrification requiring 5-7 million extra tonnes annually.
- Cost Discipline: All-in costs lowered to US$1,000-US$1,500/ton.
- Long-Term Capacity Goal: Doubling capacity to 700,000 tpa by 2035.
Furthermore, Vale is actively pursuing growth projects, such as the joint evaluation with Glencore in the Sudbury Basin, which is projected to produce an estimated 880,000 tonnes of copper over 21 years with a capital cost between $1.6bn and $2bn.
Vale S.A. (VALE) - BCG Matrix: Cash Cows
You're analyzing the core engine of Vale S.A.'s financial stability, the segment that prints the money to fund everything else. That's the Cash Cow quadrant, and for Vale S.A., that is unequivocally the Iron Ore Solutions business.
Iron Ore Solutions remains the primary Cash Cow, generating substantial free cash flow. For the second quarter of 2025, the company reported a Recurring free cash flow of $1.0 billion, which helps cover corporate overhead and fund the growth ambitions in Base Metals. This unit's market share is maintained through sheer scale and cost discipline, even as the overall market matures.
The 2025 production guidance is robust at 325-335 million tons of iron ore, maintaining a top-tier global market share. This volume commitment shows Vale S.A. is focused on maximizing throughput from its existing, high-quality assets. In Q2 2025, actual iron ore production reached 83.6 million tonnes, a 4% year-over-year increase, showing operational reliability is supporting the annual target. Still, iron ore fines shipments declined 3% (or 2.4 Mt) year-over-year in Q2 2025, reflecting a strategic choice to optimize value realization rather than simply ship volume into a soft market. You see this flexibility in action when pellet feed is redirected to fines sales. It's about maximizing cash, not just tons.
While the prompt suggested an exceptionally high EBITDA margin for Q1 2025, the reported Proforma EBITDA margin for that quarter was 39.6%. However, the operational efficiency is undeniable, as evidenced by the Q2 2025 performance where the C1 cash cost fell to a competitive $22.2 per ton, insulating margins from price volatility. This cost performance is a key competitive advantage; Vale S.A.'s 2025 C1 cash cost guidance is set between $20.5 to $22.0 per ton. The all-in costs for iron ore fines in Q2 2025 settled at $55.3 per ton. This low-cost structure is what allows the business to generate cash even when benchmark prices slide.
Market growth is low to moderate, with the average realized benchmark price for iron ore fines sliding to $85.1 per ton in Q2 2025. This is down from the Q1 2025 realized price of $90.8 per ton, confirming the downward price pressure you're seeing in the market, largely tied to demand dynamics in China. The focus here is on efficiency to protect the spread, not on aggressive market share expansion.
Here's a quick look at the cost structure that defines this Cash Cow's strength:
| Metric | Q2 2025 Value | Change vs. Q2 2024 |
| Iron Ore Fines C1 Cash Cost (ex-3rd party) | $22.2/t | Down 11% year-over-year |
| Iron Ore Fines All-in Costs | $55.3/t | Down 10% year-over-year |
| Average Realized Iron Ore Fines Price | $85.1/t | Down 13% year-over-year |
| 2025 C1 Cash Cost Guidance Range | $20.5-$22.0/t | N/A |
The cash generated here is critical for the entire Vale S.A. enterprise. You can see where that cash is being deployed to support the other quadrants:
- Funds Base Metals expansion projects, like the Onça Puma 2nd furnace investment of $555 million.
- Covers corporate administrative costs and debt servicing.
- Supports dividend payments, with $1.448 billion in interest on capital approved for September 2025 payout.
- Maintains production efficiency through targeted capital expenditures, which were $1.1 billion in Q2 2025.
Finance: draft the 13-week cash view by Friday, focusing on the sustainability of the $1.0 billion quarterly FCF generation against the $17.4 billion net debt position.
Vale S.A. (VALE) - BCG Matrix: Dogs
You're looking at the parts of Vale S.A. that aren't pulling their weight in terms of growth and market share, the classic Dogs quadrant candidates. These are the non-core assets and high-cost operations that management is actively targeting for divestiture to streamline the portfolio. It's about cutting loose the anchors to focus capital where the real upside is, so you see clear exits happening.
A clear exit move illustrating this is the sale of a majority stake in the renewable energy unit, Alianca Energia, and a solar plant. Vale agreed to sell 70% of this operation to Global Infrastructure Partners (GIP) for approximately $1 billion in cash, with the total transaction value cited as up to $1.04 billion. This strategic partnership allows Vale to accelerate its decarbonization plan in a more capital-efficient way, though Vale retains a 30% stake in the newly formed joint venture. Remember, Vale had only recently become the sole owner after paying 2.7 billion reais (about $470 million) for the remaining stake from Cemig. The portfolio involved in this exit had a total installed capacity nearing 1,300 megawatts.
Also under strategic review for potential sale are high-cost nickel operations, specifically the assets in the Thompson mine in Manitoba, Canada. Vale Base Metals launched this review, which includes the potential sale, in January 2025, with a conclusion expected in the second half of 2025. These assets, which include two operating underground mines and a mill, produced 10.5 thousand metric tonnes of finished nickel for the 12-month period ending Q3 2024. Furthermore, the high-cost nature is reflected in operational adjustments; for instance, copper production in Canada decreased by 1.2 kt year-over-year due to the discontinuation of copper precipitates recovery in Thompson in early 2025.
The strategic reduction in lower-margin output is evident in the pellet business. Vale announced cuts to its 2025 iron ore pellet production guidance to between 31 and 35 million metric tons, down from the prior forecast of 38 to 42 million tons. This reflects market conditions where steelmakers prioritize cheaper alternatives, leading to an oversupply of premium pellets. To optimize value, Vale temporarily stopped production at its São Luís pellet plant in Q3 2025 for maintenance, redirecting the pellet feed to iron ore fines sales. In Q3 2025, pellet output totaled 8.0 Mt, which was 23% (or 2.4 Mt) lower year-over-year. The average realized pellet price in that quarter was $130.8/t, down $3.3/t quarter-over-quarter.
Here's a quick look at the hard numbers associated with these divestiture and optimization candidates:
| Asset/Operation | Metric | Value/Amount | Period/Context |
| Renewable Energy Unit (Alianca) Stake Sale | Stake Sold | 70% | Agreement with GIP |
| Renewable Energy Unit (Alianca) Sale | Cash Proceeds (Up to) | $1.04 billion | Transaction Value |
| Thompson Mine (Nickel) | Finished Nickel Production | 10.5 thousand metric tonnes | 12 months ending Q3 2024 |
| Thompson Mine (Copper) | Production Change (y/y) | Decreased by 1.2 kt | Early 2025 due to operational change |
| Pellet Production Target (2025) | Revised Guidance (Low End) | 31 million metric tons | 2025 Forecast |
| Pellet Production (Q3 2025) | Output | 8.0 Mt | Year-over-year decline of 23% |
| Pellet Price (Q3 2025) | Average Realized Price | $130.8/t | Quarter-over-quarter decrease of $3.3/t |
The strategic actions taken against these lower-performing segments include:
- Divestiture of 70% stake in Alianca Energia for up to $1.04 billion.
- Strategic review, including potential sale, of Thompson mine assets concluded in 2H 2025.
- São Luís pellet plant suspended operations in Q3 2025 for maintenance.
- 2025 pellet production target lowered by approximately 7 million tons.
Vale S.A. (VALE) - BCG Matrix: Question Marks
You're looking at Vale S.A.'s (VALE) nickel business, and honestly, it fits the Question Mark profile perfectly: high potential growth markets clashing with a current low market share position relative to the capital required to win there. These are the new ventures, the ones buyers haven't fully committed to yet, even though the underlying market is expanding rapidly.
Nickel is the classic Question Mark for Vale S.A. It sits in a market segment with high long-term growth prospects but currently demands significant investment with uncertain near-term returns. The strategy here is clear: you either pour in the cash to capture market share quickly, or these assets risk slipping into the Dog quadrant as capital drains away.
The long-term outlook is compelling. Analysts project a 200% surge in demand for batteries by 2030, which is the engine for nickel's future. However, the short-term market reality is a significant oversupply. The International Nickel Study Group (INSG) forecasts a global nickel market surplus of 198,000 metric tons for 2025, with production at 3.735 million tons against usage of 3.537 million tons for that year. This oversupply puts downward pressure on prices; for instance, the London Metal Exchange (LME) average price dipped to $15,078 per metric ton by early 2025.
Vale S.A. is one of the largest nickel producers globally, but here's the pinch: high-cost assets are struggling when prices fall below profitability thresholds. Vale's guidance for its all-in nickel cost in 2025 is around $13,000/t, which is perilously close to the early 2025 average market price. In Q1 2025, the adjusted all-in nickel cost was $15,730 per mt, showing that efficiency gains are necessary just to stay afloat in the current pricing environment.
The company is still guiding for production growth, signaling its belief in the long-term thesis. Production guidance for 2025 is set at the top end of the range around 175,000 tons (kt), with a target to reach 175,000 to 200,000 tons in 2026, and a long-term goal of 210,000 to 250,000 tons by 2030. This requires significant capital commitment to bring future capacity online.
Here's a quick look at the capital allocation supporting this high-risk bet:
| Metric | 2025 Value | 2026 Value |
| Total CAPEX (US$ billion) | ~5.5 | 5.4-5.7 |
| Investment for Growth (US$ billion) | ~1.2 | ~1.1 |
| Vale Base Metals CAPEX (US$ billion) | ~1.6 | ~1.6 |
The company is investing $1.6 billion specifically in Vale Base Metals (which includes nickel) for 2026, part of a total capital expenditure budget of $5.4 billion to $5.7 billion for that year. This heavy investment in Base Metals, while iron ore remains the core cash generator, is a high-risk bet on a future nickel price recovery driven by the energy transition. You're betting that today's low returns will transform into tomorrow's Star performance.
The operational reality in 2025 shows momentum, but also cost pressure:
- 2025 Nickel Production Guidance (Top End): 175,000 kt
- Q2 2025 Nickel Production: 40,300 tonnes
- 2026 Nickel Production Guidance Range: 175,000 to 200,000 kt
- All-in Nickel Cost (2025 Estimate): ~$13,000/t
- Long-Term Demand Outlook: 200% surge by 2030
Finance: draft the sensitivity analysis for the 2026 Base Metals CAPEX against nickel prices of $15,000/t and $17,000/t by next Tuesday.
Disclaimer
All information, articles, and product details provided on this website are for general informational and educational purposes only. We do not claim any ownership over, nor do we intend to infringe upon, any trademarks, copyrights, logos, brand names, or other intellectual property mentioned or depicted on this site. Such intellectual property remains the property of its respective owners, and any references here are made solely for identification or informational purposes, without implying any affiliation, endorsement, or partnership.
We make no representations or warranties, express or implied, regarding the accuracy, completeness, or suitability of any content or products presented. Nothing on this website should be construed as legal, tax, investment, financial, medical, or other professional advice. In addition, no part of this site—including articles or product references—constitutes a solicitation, recommendation, endorsement, advertisement, or offer to buy or sell any securities, franchises, or other financial instruments, particularly in jurisdictions where such activity would be unlawful.
All content is of a general nature and may not address the specific circumstances of any individual or entity. It is not a substitute for professional advice or services. Any actions you take based on the information provided here are strictly at your own risk. You accept full responsibility for any decisions or outcomes arising from your use of this website and agree to release us from any liability in connection with your use of, or reliance upon, the content or products found herein.