
|
Vedanta Limited (VEDL.NS): BCG Matrix |
Fully Editable: Tailor To Your Needs In Excel Or Sheets
Professional Design: Trusted, Industry-Standard Templates
Investor-Approved Valuation Models
MAC/PC Compatible, Fully Unlocked
No Expertise Is Needed; Easy To Follow
Vedanta Limited (VEDL.NS) Bundle
In the dynamic landscape of Vedanta Limited, the Boston Consulting Group Matrix unveils a fascinating tableau of its business units, categorizing them into Stars, Cash Cows, Dogs, and Question Marks. Each segment showcases the potential and challenges the company faces in its quest for sustained growth and profitability. Dive deeper to uncover how Vedanta’s diversified portfolio navigates through promising ventures and underperforming assets, influencing its strategic direction and financial health.
Background of Vedanta Limited
Vedanta Limited is a prominent Indian multinational mining and metals company, headquartered in Mumbai. Established in 1976, the company has evolved into one of the largest natural resource companies in the world. It operates across various sectors, including zinc, lead, silver, copper, iron ore, aluminum, and oil and gas.
As of 2023, Vedanta is a subsidiary of Vedanta Resources Limited, which is owned by the London-based industrialist Anil Agarwal. The company has consistently focused on sustainable mining practices, aiming to reduce its environmental footprint while maximizing resource extraction. This approach is integral to its business model, given the increasing global emphasis on sustainability.
Financially, Vedanta Limited reported revenues of approximately INR 1,00,000 crore (around USD 13.3 billion) for the fiscal year ending March 2023. The company has seen fluctuating stock performance, influenced by commodity prices and regulatory changes in India.
Vedanta has established its presence in various significant mining locations, including the states of Rajasthan, Odisha, and Chhattisgarh. It also has operations in Africa and Australia, further diversifying its geographical footprint. The company employs over 65,000 people globally, and its commitment to corporate social responsibility has been highlighted through various community development programs.
Over the years, Vedanta has faced its share of challenges, including regulatory scrutiny and environmental concerns. However, its resilience and strategic initiatives, including joint ventures and technological advancements, have reinforced its standing in the competitive mining sector.
Vedanta Limited - BCG Matrix: Stars
Vedanta Limited, a globally diversified natural resources company, showcases several business units categorized as Stars in the Boston Consulting Group (BCG) Matrix. These units demonstrate high market share in rapidly growing markets, making them crucial for the company's overall strategy.
Zinc Production
Vedanta’s zinc production, primarily through its subsidiary Hindustan Zinc Limited, is one of the largest in the world. For the fiscal year 2023, Hindustan Zinc reported a production volume of 1.14 million tons of zinc. The company holds a market share of approximately 70% in the Indian zinc industry, which is experiencing robust growth driven by increased demand in construction and automotive sectors.
The financial contribution from the zinc segment is significant, with operational revenue for Hindustan Zinc recorded at INR 27,844 crore (approximately USD 3.75 billion) in FY 2023. The EBITDA margin for this segment stands at 40%, indicating strong profitability relative to its operational costs.
Copper Operations in India
Vedanta’s copper operations, primarily located in Tuticorin, Tamil Nadu, represent another Star in its portfolio. The company produced approximately 350,000 tons of copper cathodes in FY 2023, capitalizing on an increasing market share estimated at 34% in the Indian copper market.
In FY 2023, the copper segment achieved revenues of INR 14,663 crore (around USD 2 billion), with an EBITDA margin slightly lower than zinc at 30%. This reflects both high operational costs and the necessity for continuous investment in technology and infrastructure to maintain competitive advantage.
Oil & Gas Exploration
Vedanta's oil and gas exploration, particularly through its subsidiary Vedanta Resources, is another significant contributor. The average daily production reached approximately 200,000 barrels of oil equivalent per day (boepd) for the fiscal year 2023. The company commands a substantial market position, holding about 10% of India's total crude oil production.
In FY 2023, Vedanta's oil and gas segment generated revenue of INR 20,523 crore (approximately USD 2.8 billion), with a reported EBITDA margin of 35%. The growing demand for energy and a focus on sustainability initiatives positions Vedanta favorably in this segment, requiring ongoing investment to enhance production capabilities.
| Segment | Production Volume | Market Share | Revenues (FY 2023) | EBITDA Margin |
|---|---|---|---|---|
| Zinc Production | 1.14 million tons | 70% | INR 27,844 crore (USD 3.75 billion) | 40% |
| Copper Operations | 350,000 tons | 34% | INR 14,663 crore (USD 2 billion) | 30% |
| Oil & Gas Exploration | 200,000 boepd | 10% | INR 20,523 crore (USD 2.8 billion) | 35% |
Vedanta's strategic emphasis on these Star segments underlines its commitment to maintaining a high market presence while driving future growth, particularly as they continue to require substantial investments for ongoing development and market competition.
Vedanta Limited - BCG Matrix: Cash Cows
In the context of Vedanta Limited, a multi-national mining and metals company, the BCG Matrix identifies several key segments that serve as Cash Cows, primarily in Aluminium manufacturing, Iron ore mining, and Power generation. These segments exhibit high market shares in mature industries, yielding substantial cash flows.
Aluminium Manufacturing
Vedanta's aluminium division is positioned as a Cash Cow, capturing a significant share of the market. In FY2023, the company reported aluminium production of 2.27 million tonnes. The segment's revenue for the same year reached approximately ₹28,000 crores (about $3.4 billion), bolstered by high aluminium prices which averaged around $2,400 per tonne. The division operates with a healthy EBITDA margin of approximately 25%, indicating strong profitability in a stable market. The low growth in the aluminium segment is evidenced by a compound annual growth rate (CAGR) of about 3% over the past five years, expecting to maintain stable output without significant new investment.
Iron Ore Mining
Vedanta is also a major player in iron ore mining, primarily in Goa and Karnataka. The production in FY2023 stood at 14.1 million tonnes, with revenues hitting ₹12,000 crores (around $1.5 billion). The segment benefits from strong demand in the steel industry, leading to an EBITDA margin of approximately 40%. The pricing for iron ore averaged around $120 per tonne, reflecting fluctuations in global markets. The mature market condition allows Vedanta to focus on operational efficiency, ensuring low capital expenditures while generating substantial cash flows. The low growth in this segment is marked by a steady output with minimal market expansion anticipated.
Power Generation
Vedanta's power generation segment, through its subsidiary, is another lucrative Cash Cow. In FY2023, it generated approximately 3,700 MW of power, contributing revenues of around ₹9,000 crores (approximately $1.1 billion). The segment enjoys a relatively stable EBITDA margin of about 30%, attributed to long-term Power Purchase Agreements (PPAs) that secure consistent cash inflows. The segment's overall growth remains low with a CAGR of less than 2%, as it primarily focuses on maintaining existing infrastructure rather than extensive new investments.
| Segment | Production (FY2023) | Revenue (₹ Crores) | EBITDA Margin (%) | Average Cost per Tonne ($) |
|---|---|---|---|---|
| Aluminium Manufacturing | 2.27 million tonnes | 28,000 | 25 | 2,400 |
| Iron Ore Mining | 14.1 million tonnes | 12,000 | 40 | 120 |
| Power Generation | 3,700 MW | 9,000 | 30 | N/A |
These Cash Cows play a crucial role in Vedanta's overall financial health, providing the necessary cash flow to support emerging segments while funding operational stability. The low investment requirements combined with high profit margins underscore the importance of these units in sustaining the company's competitive edge.
Vedanta Limited - BCG Matrix: Dogs
The coal business segment of Vedanta Limited has been facing several challenges over recent years. As of FY2023, the contribution of coal to Vedanta’s overall revenue has declined significantly, accounting for approximately 8% of total revenue. The company produced around 9 million tons of coal in FY2023, with sales revenue reaching approximately ₹4,000 crore, reflecting stagnant growth due to regulatory hurdles and increasing competition.
In the realm of steel production, Vedanta has struggled to gain a significant foothold. The steel division reported revenues of around ₹1,500 crore in FY2023, contributing less than 5% to the company’s total earnings. With a production capacity stagnating at 1 million tons annually and a market share in India hovering around 3%, this sector is currently categorized as a 'Dog' with limited growth prospects.
Another area of concern includes Vedanta’s involvement in various less profitable joint ventures. For instance, the partnership with Electrosteel Steels Limited has provided minimal returns, contributing less than ₹500 crore to total revenue. This venture, along with others in the infrastructure space, has been identified as a cash trap, consuming investments without yielding significant cash inflow.
| Business Segment | FY2023 Revenue (₹ Crore) | Market Share (%) | Production Volume (Million Tons) |
|---|---|---|---|
| Coal Business | 4,000 | 8 | 9 |
| Steel Production | 1,500 | 3 | 1 |
| Joint Ventures | 500 | N/A | N/A |
Considering these factors, the coal and steel divisions along with underperforming joint ventures possess low growth and market share attributes, categorizing them firmly within the 'Dogs' quadrant of the BCG Matrix. The implications of this positioning suggest a strategic need for Vedanta to consider divestiture or restructuring initiatives to optimize overall resource allocation.
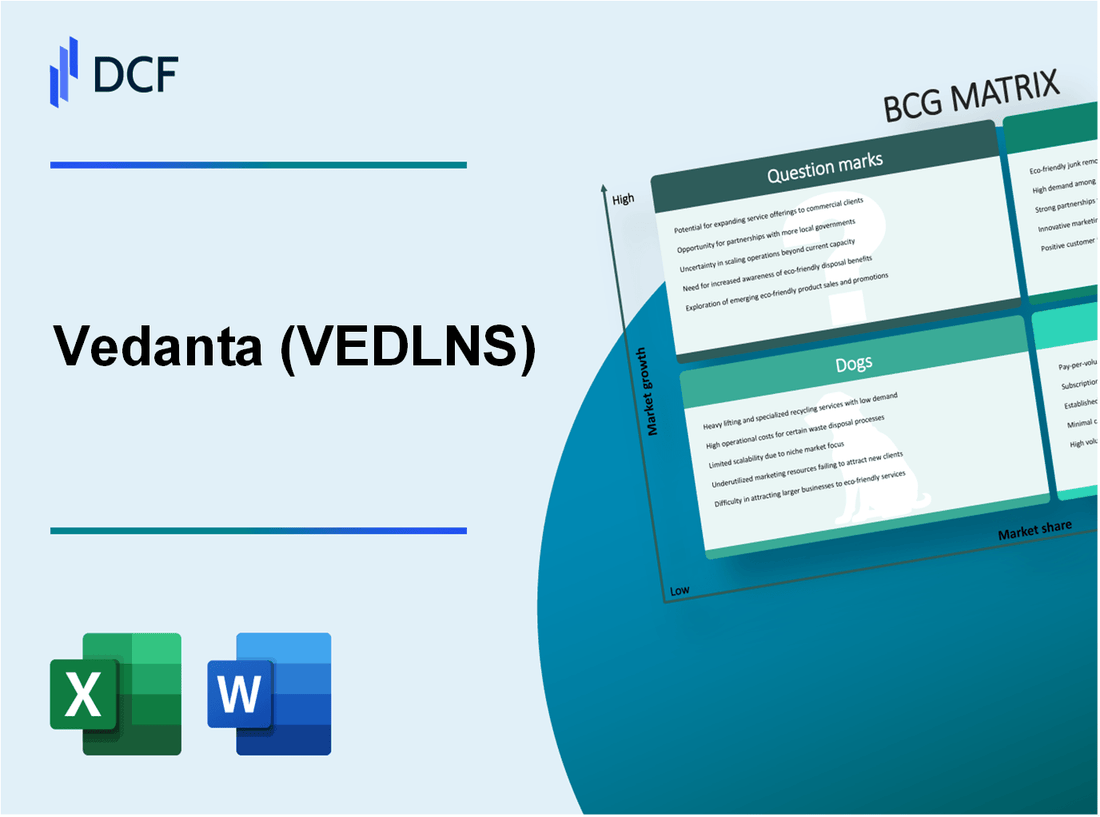
Vedanta Limited - BCG Matrix: Question Marks
Question Marks in Vedanta Limited's portfolio reflect businesses in high-growth sectors but with low market shares. These segments require strategic focus to potentially transition into Stars in the BCG Matrix.
Overseas Copper Operations
Vedanta's overseas copper operations, particularly in Zambia and other regions, have seen fluctuating performance. As of 2023, Vedanta's Zambian copper production was approximately 92,000 tons, with revenues impacted by volatile copper prices. In FY 2022, copper prices averaged around $4.50 per pound, but have since fallen, placing pressure on margins.
The average market share of Vedanta's copper products in these regions is noted to be around 6% to 8%, indicating great growth potential as demand for copper grows due to increased electrification and renewable energy initiatives.
New Renewable Energy Initiatives
Vedanta has been pivoting towards sustainability by investing in renewable energy projects. In 2023, the company allocated approximately ₹1,500 crores towards solar and wind energy initiatives. Despite the high growth potential, their market share in the renewable energy segment is currently around 3%.
According to market analysis, the renewable energy market in India is projected to grow at a CAGR of 17% from 2022 to 2030. The potential shift in energy consumption patterns presents an attractive opportunity for Vedanta if they can capture a more significant market share.
E-commerce Mineral Sales
Vedanta's foray into e-commerce for mineral sales is still in nascent stages, with current sales valued at approximately ₹200 crores in FY 2023. This market is highly competitive, and Vedanta holds a mere 2% of the total e-commerce mineral sales in the region.
The company's e-commerce initiatives reportedly have growth projections looking towards a 25% annual increase in the segment, driven by increasing digital adoption among consumers. However, significant investment in marketing and technology is needed to improve market visibility and presence.
| Initiative | Current Market Share | Investment FY 2023 | Estimated Revenue Growth |
|---|---|---|---|
| Overseas Copper Operations | 6%-8% | Not Disclosed | Dependent on pricing |
| New Renewable Energy Initiatives | 3% | ₹1,500 crores | 17% CAGR |
| E-commerce Mineral Sales | 2% | ₹200 crores | 25% Annual Increase |
Overall, Vedanta's Question Marks represent significant potential for future growth, but also require careful management to enhance market share and reduce cash consumption. Each segment has varying degrees of investment and market engagement, impacting their transition towards becoming Stars in the BCG framework.
The BCG Matrix offers a revealing snapshot of Vedanta Limited's diverse portfolio, highlighting where the company thrives and areas needing strategic focus. With strong performance in its Stars and Cash Cows, Vedanta is well-positioned for growth, while its Dogs and Question Marks indicate potential risks and opportunities for innovation. Understanding these dynamics is essential for stakeholders looking to navigate Vedanta's future in a competitive landscape.
[right_small]Disclaimer
All information, articles, and product details provided on this website are for general informational and educational purposes only. We do not claim any ownership over, nor do we intend to infringe upon, any trademarks, copyrights, logos, brand names, or other intellectual property mentioned or depicted on this site. Such intellectual property remains the property of its respective owners, and any references here are made solely for identification or informational purposes, without implying any affiliation, endorsement, or partnership.
We make no representations or warranties, express or implied, regarding the accuracy, completeness, or suitability of any content or products presented. Nothing on this website should be construed as legal, tax, investment, financial, medical, or other professional advice. In addition, no part of this site—including articles or product references—constitutes a solicitation, recommendation, endorsement, advertisement, or offer to buy or sell any securities, franchises, or other financial instruments, particularly in jurisdictions where such activity would be unlawful.
All content is of a general nature and may not address the specific circumstances of any individual or entity. It is not a substitute for professional advice or services. Any actions you take based on the information provided here are strictly at your own risk. You accept full responsibility for any decisions or outcomes arising from your use of this website and agree to release us from any liability in connection with your use of, or reliance upon, the content or products found herein.