
|
Twin Vee Powercats Co. (VEEE) DCF Valuation |
Fully Editable: Tailor To Your Needs In Excel Or Sheets
Professional Design: Trusted, Industry-Standard Templates
Investor-Approved Valuation Models
MAC/PC Compatible, Fully Unlocked
No Expertise Is Needed; Easy To Follow
Twin Vee Powercats Co. (VEEE) Bundle
Discover Twin Vee Powercats Co.'s true potential with our advanced DCF Calculator! Adjust key assumptions, explore various scenarios, and examine how different changes influence Twin Vee Powercats Co. (VEEE) valuation – all within a comprehensive Excel template.
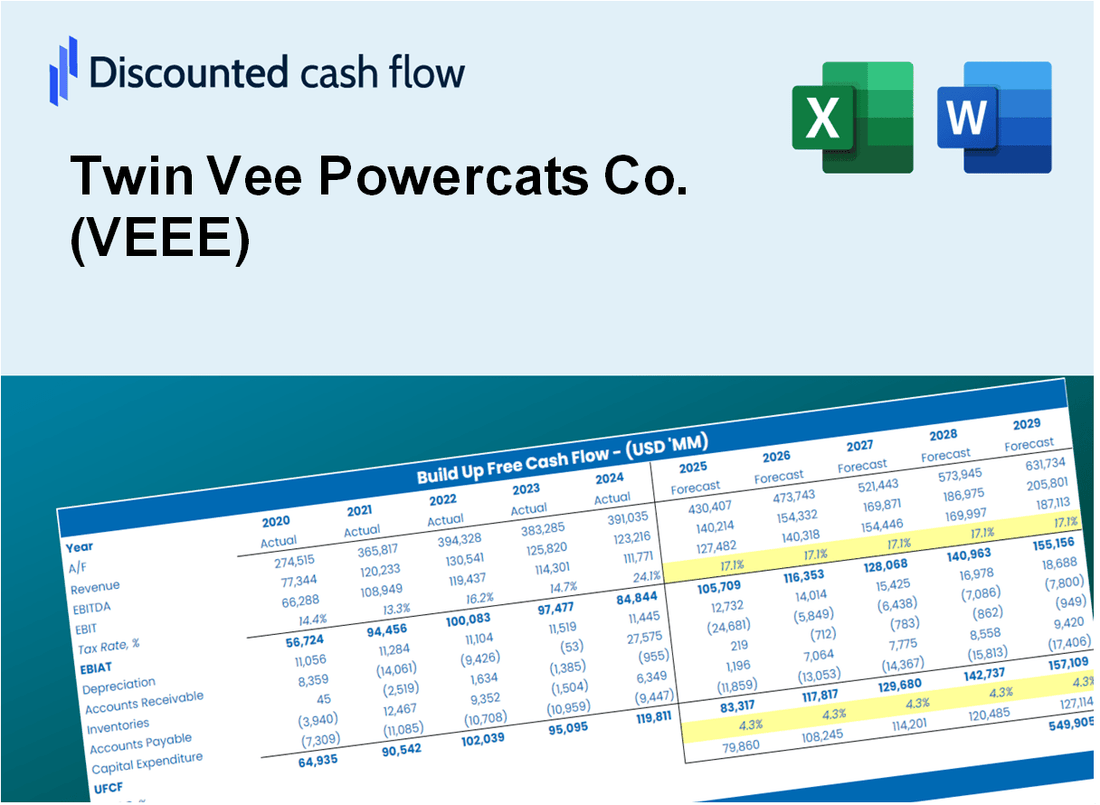
Discounted Cash Flow (DCF) - (USD MM)
| Year | AY1 2020 |
AY2 2021 |
AY3 2022 |
AY4 2023 |
AY5 2024 |
FY1 2025 |
FY2 2026 |
FY3 2027 |
FY4 2028 |
FY5 2029 |
|---|---|---|---|---|---|---|---|---|---|---|
| Revenue | 11.1 | 15.8 | 32.0 | 33.4 | 14.4 | 17.6 | 21.6 | 26.5 | 32.4 | 39.7 |
| Revenue Growth, % | 0 | 42.58 | 102.79 | 4.5 | -56.95 | 22.53 | 22.53 | 22.53 | 22.53 | 22.53 |
| EBITDA | 1.5 | -.7 | -5.1 | -8.2 | -12.5 | -4.2 | -5.1 | -6.2 | -7.6 | -9.4 |
| EBITDA, % | 13.61 | -4.28 | -15.87 | -24.55 | -86.79 | -23.58 | -23.58 | -23.58 | -23.58 | -23.58 |
| Depreciation | .2 | .2 | .6 | 1.4 | 1.7 | .7 | .9 | 1.1 | 1.3 | 1.6 |
| Depreciation, % | 1.41 | 1.26 | 1.73 | 4.05 | 12.13 | 4.12 | 4.12 | 4.12 | 4.12 | 4.12 |
| EBIT | 1.3 | -.9 | -5.6 | -9.6 | -14.2 | -4.9 | -6.0 | -7.3 | -9.0 | -11.0 |
| EBIT, % | 12.2 | -5.54 | -17.6 | -28.6 | -98.92 | -27.69 | -27.69 | -27.69 | -27.69 | -27.69 |
| Total Cash | .9 | 10.0 | 25.0 | 21.0 | 7.5 | 9.3 | 11.4 | 14.0 | 17.1 | 21.0 |
| Total Cash, percent | .0 | .0 | .0 | .0 | .0 | .0 | .0 | .0 | .0 | .0 |
| Account Receivables | .0 | .3 | .0 | .1 | .0 | .1 | .1 | .1 | .1 | .2 |
| Account Receivables, % | 0.05513567 | 1.85 | 0.04428887 | 0.23981 | 0 | 0.43815 | 0.43815 | 0.43815 | 0.43815 | 0.43815 |
| Inventories | .9 | 1.8 | 4.0 | 4.9 | 2.5 | 2.3 | 2.8 | 3.4 | 4.2 | 5.1 |
| Inventories, % | 8.47 | 11.41 | 12.53 | 14.61 | 17.49 | 12.9 | 12.9 | 12.9 | 12.9 | 12.9 |
| Accounts Payable | .8 | 1.2 | 2.1 | 2.4 | 2.2 | 1.5 | 1.9 | 2.3 | 2.8 | 3.5 |
| Accounts Payable, % | 7.22 | 7.61 | 6.46 | 7.18 | 15.39 | 8.77 | 8.77 | 8.77 | 8.77 | 8.77 |
| Capital Expenditure | -.5 | -1.9 | -3.4 | -5.2 | -6.3 | -3.1 | -3.8 | -4.6 | -5.6 | -6.9 |
| Capital Expenditure, % | -4.75 | -12.3 | -10.52 | -15.44 | -44.07 | -17.42 | -17.42 | -17.42 | -17.42 | -17.42 |
| Tax Rate, % | 21.16 | 21.16 | 21.16 | 21.16 | 21.16 | 21.16 | 21.16 | 21.16 | 21.16 | 21.16 |
| EBITAT | 1.3 | -.9 | -5.0 | -7.0 | -11.2 | -4.3 | -5.3 | -6.5 | -7.9 | -9.7 |
| Depreciation | ||||||||||
| Changes in Account Receivables | ||||||||||
| Changes in Inventories | ||||||||||
| Changes in Accounts Payable | ||||||||||
| Capital Expenditure | ||||||||||
| UFCF | .8 | -3.4 | -8.9 | -11.4 | -13.6 | -7.2 | -8.3 | -10.2 | -12.5 | -15.3 |
| WACC, % | 7.2 | 7.2 | 6.77 | 6.21 | 6.41 | 6.76 | 6.76 | 6.76 | 6.76 | 6.76 |
| PV UFCF | ||||||||||
| SUM PV UFCF | -43.1 | |||||||||
| Long Term Growth Rate, % | 2.00 | |||||||||
| Free cash flow (T + 1) | -16 | |||||||||
| Terminal Value | -329 | |||||||||
| Present Terminal Value | -237 | |||||||||
| Enterprise Value | -280 | |||||||||
| Net Debt | -4 | |||||||||
| Equity Value | -276 | |||||||||
| Diluted Shares Outstanding, MM | 1 | |||||||||
| Equity Value Per Share | -275.28 |
What You Will Receive
- Pre-Configured Financial Model: Twin Vee Powercats Co.'s actual data facilitates accurate DCF valuation.
- Comprehensive Forecast Control: Modify revenue growth, profit margins, WACC, and other essential variables.
- Real-Time Calculations: Automatic updates provide immediate feedback as you adjust inputs.
- Professional-Grade Template: A polished Excel file crafted for high-quality valuation.
- Flexible and Reusable: Designed for adaptability, making it suitable for repeated detailed forecasts.
Key Features
- Comprehensive Data: Twin Vee Powercats Co.’s historical financials and projected forecasts.
- Customizable Variables: Adjust WACC, tax rates, revenue growth, and EBITDA margins to fit your analysis.
- Real-Time Calculations: Instantly view Twin Vee’s intrinsic value as inputs are modified.
- Intuitive Visualizations: Dashboard graphs illustrate valuation outcomes and essential metrics.
- Designed for Precision: A reliable tool for analysts, investors, and finance professionals.
How It Works
- 1. Access the Template: Download and open the Excel file featuring Twin Vee Powercats Co. (VEEE) preloaded data.
- 2. Modify Assumptions: Adjust essential inputs such as growth projections, WACC, and capital expenditures.
- 3. View Results in Real-Time: The DCF model automatically computes intrinsic value and NPV.
- 4. Explore Scenarios: Evaluate various forecasts to understand different valuation possibilities.
- 5. Make Informed Decisions: Share expert valuation insights to enhance your strategic choices.
Why Choose Twin Vee Powercats Co. (VEEE)?
- Innovative Design: Our powercats are engineered for optimal performance on the water.
- Exceptional Quality: Built with high-grade materials to ensure durability and longevity.
- Customizable Options: Personalize your boat to suit your specific needs and preferences.
- Easy Handling: User-friendly features make navigating our powercats a breeze.
- Proven Track Record: Trusted by boating enthusiasts and professionals alike for reliability.
Who Should Use This Product?
- Marine Industry Professionals: Develop comprehensive and accurate valuation models for analyzing Twin Vee Powercats Co. (VEEE) investments.
- Corporate Finance Teams: Evaluate valuation scenarios to inform strategic decision-making within the marine sector.
- Consultants and Advisors: Offer clients precise valuation insights for Twin Vee Powercats Co. (VEEE) stock.
- Students and Educators: Utilize real-world data to enhance learning and practice in financial modeling related to marine businesses.
- Boating Enthusiasts: Gain insights into how companies like Twin Vee Powercats Co. (VEEE) are valued in the boating market.
What the Template Contains
- Pre-Filled Data: Incorporates Twin Vee Powercats Co.'s historical financials and projections.
- Discounted Cash Flow Model: Editable DCF valuation model featuring automatic calculations.
- Weighted Average Cost of Capital (WACC): A specific sheet for calculating WACC based on user-defined inputs.
- Key Financial Ratios: Assess Twin Vee Powercats Co.'s profitability, efficiency, and leverage metrics.
- Customizable Inputs: Easily adjust revenue growth, margins, and tax rates.
- Clear Dashboard: Visuals and tables summarizing essential valuation outcomes.
Disclaimer
All information, articles, and product details provided on this website are for general informational and educational purposes only. We do not claim any ownership over, nor do we intend to infringe upon, any trademarks, copyrights, logos, brand names, or other intellectual property mentioned or depicted on this site. Such intellectual property remains the property of its respective owners, and any references here are made solely for identification or informational purposes, without implying any affiliation, endorsement, or partnership.
We make no representations or warranties, express or implied, regarding the accuracy, completeness, or suitability of any content or products presented. Nothing on this website should be construed as legal, tax, investment, financial, medical, or other professional advice. In addition, no part of this site—including articles or product references—constitutes a solicitation, recommendation, endorsement, advertisement, or offer to buy or sell any securities, franchises, or other financial instruments, particularly in jurisdictions where such activity would be unlawful.
All content is of a general nature and may not address the specific circumstances of any individual or entity. It is not a substitute for professional advice or services. Any actions you take based on the information provided here are strictly at your own risk. You accept full responsibility for any decisions or outcomes arising from your use of this website and agree to release us from any liability in connection with your use of, or reliance upon, the content or products found herein.