
|
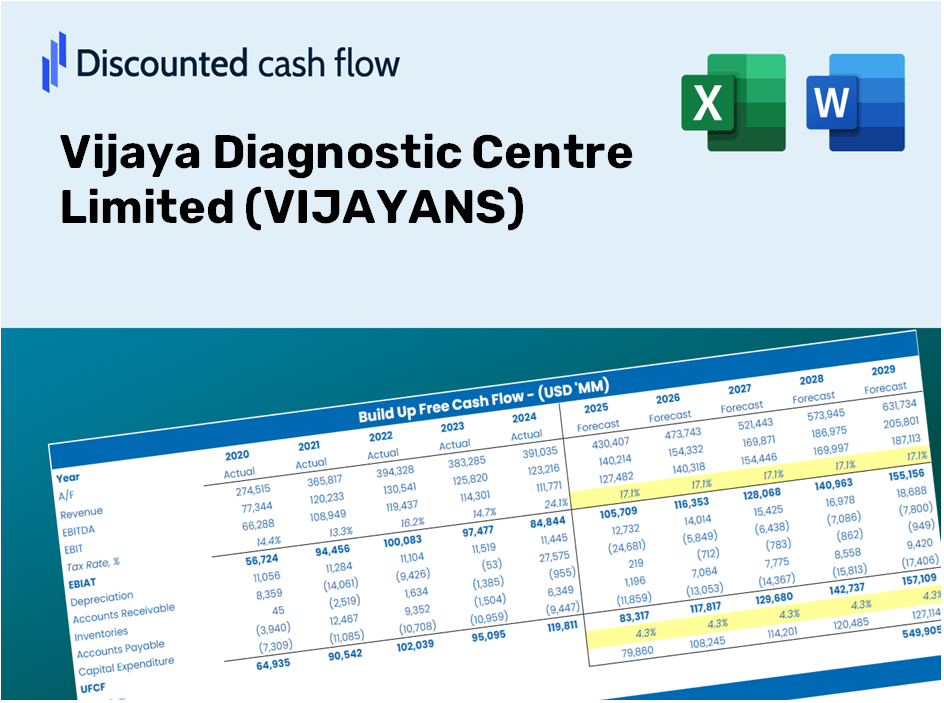
Vijaya Diagnostic Centre Limited (VIJAYA.NS) DCF Valuation |
Fully Editable: Tailor To Your Needs In Excel Or Sheets
Professional Design: Trusted, Industry-Standard Templates
Investor-Approved Valuation Models
MAC/PC Compatible, Fully Unlocked
No Expertise Is Needed; Easy To Follow
Vijaya Diagnostic Centre Limited (VIJAYA.NS) Bundle
Discover the true potential of Vijaya Diagnostic Centre Limited (VIJAYANS) with our advanced DCF Calculator! Adjust essential assumptions, explore various scenarios, and evaluate the effects of changes on the valuation of Vijaya Diagnostic Centre Limited (VIJAYANS) – all within one comprehensive Excel template.
Discounted Cash Flow (DCF) - (USD MM)
| Year | AY1 2021 |
AY2 2022 |
AY3 2023 |
AY4 2024 |
AY5 2025 |
FY1 2026 |
FY2 2027 |
FY3 2028 |
FY4 2029 |
FY5 2030 |
|---|---|---|---|---|---|---|---|---|---|---|
| Revenue | 3,764.5 | 4,621.1 | 4,592.2 | 5,478.1 | 6,813.9 | 7,934.9 | 9,240.2 | 10,760.3 | 12,530.5 | 14,591.9 |
| Revenue Growth, % | 0 | 22.75 | -0.62541 | 19.29 | 24.39 | 16.45 | 16.45 | 16.45 | 16.45 | 16.45 |
| EBITDA | 1,772.9 | 2,160.2 | 1,956.6 | 2,390.7 | 2,732.2 | 3,494.3 | 4,069.2 | 4,738.6 | 5,518.1 | 6,425.9 |
| EBITDA, % | 47.1 | 46.75 | 42.61 | 43.64 | 40.1 | 44.04 | 44.04 | 44.04 | 44.04 | 44.04 |
| Depreciation | 504.5 | 526.9 | 617.2 | 570.0 | 706.0 | 936.4 | 1,090.5 | 1,269.9 | 1,478.8 | 1,722.1 |
| Depreciation, % | 13.4 | 11.4 | 13.44 | 10.4 | 10.36 | 11.8 | 11.8 | 11.8 | 11.8 | 11.8 |
| EBIT | 1,268.4 | 1,633.4 | 1,339.4 | 1,820.7 | 2,026.2 | 2,557.9 | 2,978.7 | 3,468.7 | 4,039.3 | 4,703.8 |
| EBIT, % | 33.69 | 35.35 | 29.17 | 33.24 | 29.74 | 32.24 | 32.24 | 32.24 | 32.24 | 32.24 |
| Total Cash | 2,195.8 | 2,251.5 | 2,554.1 | 1,846.6 | 2,334.8 | 3,660.2 | 4,262.4 | 4,963.6 | 5,780.1 | 6,731.0 |
| Total Cash, percent | .0 | .0 | .0 | .0 | .0 | .0 | .0 | .0 | .0 | .0 |
| Account Receivables | 67.0 | 147.6 | 131.6 | 162.4 | 147.6 | 205.8 | 239.7 | 279.1 | 325.1 | 378.5 |
| Account Receivables, % | 1.78 | 3.19 | 2.87 | 2.96 | 2.17 | 2.59 | 2.59 | 2.59 | 2.59 | 2.59 |
| Inventories | 26.4 | 42.8 | 20.5 | 51.8 | 49.3 | 59.4 | 69.2 | 80.6 | 93.8 | 109.3 |
| Inventories, % | 0.70234 | 0.92547 | 0.4461 | 0.94608 | 0.72392 | 0.74878 | 0.74878 | 0.74878 | 0.74878 | 0.74878 |
| Accounts Payable | 221.6 | 216.4 | 277.1 | 329.5 | 331.3 | 436.1 | 507.9 | 591.4 | 688.7 | 802.0 |
| Accounts Payable, % | 5.89 | 4.68 | 6.04 | 6.01 | 4.86 | 5.5 | 5.5 | 5.5 | 5.5 | 5.5 |
| Capital Expenditure | -321.4 | -1,223.5 | -1,248.4 | -879.6 | -955.5 | -1,464.4 | -1,705.3 | -1,985.9 | -2,312.6 | -2,693.0 |
| Capital Expenditure, % | -8.54 | -26.48 | -27.19 | -16.06 | -14.02 | -18.46 | -18.46 | -18.46 | -18.46 | -18.46 |
| Tax Rate, % | 25.93 | 25.93 | 25.93 | 25.93 | 25.93 | 25.93 | 25.93 | 25.93 | 25.93 | 25.93 |
| EBITAT | 955.7 | 1,215.5 | 998.7 | 1,363.4 | 1,500.8 | 1,909.6 | 2,223.7 | 2,589.5 | 3,015.5 | 3,511.6 |
| Depreciation | ||||||||||
| Changes in Account Receivables | ||||||||||
| Changes in Inventories | ||||||||||
| Changes in Accounts Payable | ||||||||||
| Capital Expenditure | ||||||||||
| UFCF | 1,267.0 | 416.8 | 466.5 | 1,043.9 | 1,270.4 | 1,418.0 | 1,637.0 | 1,906.3 | 2,219.9 | 2,585.0 |
| WACC, % | 4.73 | 4.73 | 4.73 | 4.73 | 4.73 | 4.73 | 4.73 | 4.73 | 4.73 | 4.73 |
| PV UFCF | ||||||||||
| SUM PV UFCF | 8,402.9 | |||||||||
| Long Term Growth Rate, % | 4.00 | |||||||||
| Free cash flow (T + 1) | 2,688 | |||||||||
| Terminal Value | 368,576 | |||||||||
| Present Terminal Value | 292,539 | |||||||||
| Enterprise Value | 300,942 | |||||||||
| Net Debt | 2,707 | |||||||||
| Equity Value | 298,235 | |||||||||
| Diluted Shares Outstanding, MM | 103 | |||||||||
| Equity Value Per Share | 2,901.57 |
What You Will Receive
- Authentic Vijaya Data: Comprehensive financial information – from revenue to EBIT – derived from actual and projected figures.
- Complete Customization: Modify all essential parameters (yellow cells) such as WACC, growth %, and tax rates.
- Real-Time Valuation Updates: Automatic recalculations to assess the effects of modifications on the fair value of Vijaya Diagnostic Centre Limited (VIJAYANS).
- Flexible Excel Template: Designed for easy edits, scenario analysis, and in-depth projections.
- Efficient and Precise: Eliminate the need to build models from the ground up while ensuring accuracy and adaptability.
Key Features
- 🔍 Real-Life VIJAYANS Financials: Pre-filled historical and projected data for Vijaya Diagnostic Centre Limited (VIJAYANS).
- ✏️ Fully Customizable Inputs: Modify all essential parameters (yellow cells) such as WACC, growth %, and tax rates.
- 📊 Professional DCF Valuation: Integrated formulas determine Vijaya’s intrinsic value using the Discounted Cash Flow method.
- ⚡ Instant Results: Visualize Vijaya’s valuation immediately after adjustments are made.
- Scenario Analysis: Evaluate and compare outcomes for different financial assumptions side-by-side.
How It Works
- 1. Access the Template: Download and open the Excel file containing Vijaya Diagnostic Centre Limited’s (VIJAYANS) preloaded financial data.
- 2. Adjust Assumptions: Modify key variables such as growth rates, WACC, and capital expenditures to suit your analysis.
- 3. View Results in Real-Time: The DCF model will automatically compute the intrinsic value and NPV based on your inputs.
- 4. Explore Scenarios: Evaluate various forecasts to assess different valuation results and insights.
- 5. Present with Assurance: Deliver professional valuation analyses to back your investment strategies.
Why Choose Vijaya Diagnostic Centre Limited (VIJAYANS)?
- Save Time: No need to navigate complex diagnostic processes – we provide efficient solutions.
- Enhance Accuracy: Our state-of-the-art equipment ensures reliable and precise test results.
- Completely Tailored: Customize your diagnostic plans to align with your specific health needs.
- Easy to Understand: Our clear reports and visual data make interpreting results straightforward.
- Endorsed by Professionals: Trusted by healthcare providers who prioritize quality and efficiency.
Who Should Benefit from VIJAYANS?
- Investors: Evaluate VIJAYANS' valuation before purchasing or liquidating shares.
- CFOs and Financial Analysts: Optimize valuation methodologies and assess financial forecasts.
- Startup Founders: Understand how established healthcare entities like VIJAYANS are appraised.
- Consultants: Provide detailed valuation assessments for your clients.
- Students and Educators: Utilize practical data to learn and instruct on valuation strategies.
Contents of the Template
- Pre-Filled DCF Model: Vijaya Diagnostic Centre Limited’s (VIJAYANS) financial data preloaded for immediate application.
- WACC Calculator: Comprehensive calculations for Weighted Average Cost of Capital.
- Financial Ratios: Assess VIJAYANS’ profitability, leverage, and efficiency metrics.
- Editable Inputs: Modify assumptions such as growth rates, profit margins, and capital expenditures to align with your scenarios.
- Financial Statements: Access annual and quarterly reports for in-depth analysis.
- Interactive Dashboard: Effortlessly visualize essential valuation metrics and outcomes.
Disclaimer
All information, articles, and product details provided on this website are for general informational and educational purposes only. We do not claim any ownership over, nor do we intend to infringe upon, any trademarks, copyrights, logos, brand names, or other intellectual property mentioned or depicted on this site. Such intellectual property remains the property of its respective owners, and any references here are made solely for identification or informational purposes, without implying any affiliation, endorsement, or partnership.
We make no representations or warranties, express or implied, regarding the accuracy, completeness, or suitability of any content or products presented. Nothing on this website should be construed as legal, tax, investment, financial, medical, or other professional advice. In addition, no part of this site—including articles or product references—constitutes a solicitation, recommendation, endorsement, advertisement, or offer to buy or sell any securities, franchises, or other financial instruments, particularly in jurisdictions where such activity would be unlawful.
All content is of a general nature and may not address the specific circumstances of any individual or entity. It is not a substitute for professional advice or services. Any actions you take based on the information provided here are strictly at your own risk. You accept full responsibility for any decisions or outcomes arising from your use of this website and agree to release us from any liability in connection with your use of, or reliance upon, the content or products found herein.