
|
Virbac SA (VIRP.PA) DCF Valuation |
Fully Editable: Tailor To Your Needs In Excel Or Sheets
Professional Design: Trusted, Industry-Standard Templates
Investor-Approved Valuation Models
MAC/PC Compatible, Fully Unlocked
No Expertise Is Needed; Easy To Follow
Virbac SA (VIRP.PA) Bundle
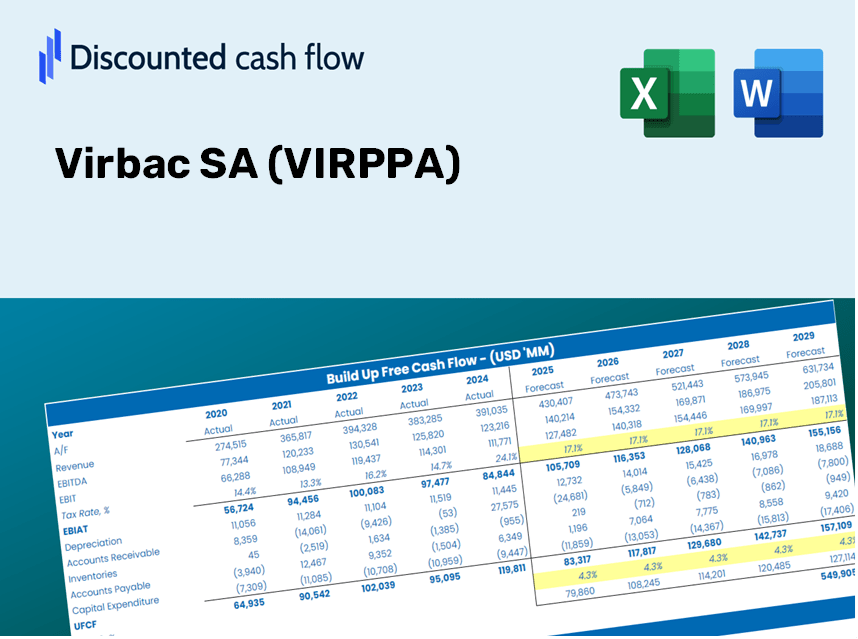
Take charge of your Virbac SA (VIRPPA) valuation analysis with our state-of-the-art DCF Calculator! Preloaded with real (VIRPPA) data, this Excel template enables you to adjust forecasts and assumptions to accurately calculate the intrinsic value of Virbac SA.
Discounted Cash Flow (DCF) - (USD MM)
| Year | AY1 2020 |
AY2 2021 |
AY3 2022 |
AY4 2023 |
AY5 2024 |
FY1 2025 |
FY2 2026 |
FY3 2027 |
FY4 2028 |
FY5 2029 |
|---|---|---|---|---|---|---|---|---|---|---|
| Revenue | 934.2 | 1,064.0 | 1,216.2 | 1,246.9 | 1,397.4 | 1,546.9 | 1,712.4 | 1,895.5 | 2,098.3 | 2,322.8 |
| Revenue Growth, % | 0 | 13.89 | 14.31 | 2.53 | 12.07 | 10.7 | 10.7 | 10.7 | 10.7 | 10.7 |
| EBITDA | 231.7 | 199.5 | 215.6 | 230.7 | 276.3 | 307.9 | 340.9 | 377.4 | 417.7 | 462.4 |
| EBITDA, % | 24.8 | 18.75 | 17.72 | 18.5 | 19.77 | 19.91 | 19.91 | 19.91 | 19.91 | 19.91 |
| Depreciation | 47.6 | 43.3 | 45.8 | 47.5 | 57.4 | 64.5 | 71.4 | 79.1 | 87.5 | 96.9 |
| Depreciation, % | 5.1 | 4.07 | 3.77 | 3.81 | 4.1 | 4.17 | 4.17 | 4.17 | 4.17 | 4.17 |
| EBIT | 184.0 | 156.1 | 169.7 | 183.1 | 218.9 | 243.4 | 269.5 | 298.3 | 330.2 | 365.5 |
| EBIT, % | 19.7 | 14.67 | 13.96 | 14.69 | 15.67 | 15.74 | 15.74 | 15.74 | 15.74 | 15.74 |
| Total Cash | 181.9 | 172.8 | 177.4 | 175.9 | 149.6 | 232.4 | 257.2 | 284.8 | 315.2 | 348.9 |
| Total Cash, percent | .0 | .0 | .0 | .0 | .0 | .0 | .0 | .0 | .0 | .0 |
| Account Receivables | 162.1 | 169.0 | 200.6 | 240.1 | 268.7 | 272.9 | 302.1 | 334.4 | 370.2 | 409.8 |
| Account Receivables, % | 17.35 | 15.88 | 16.49 | 19.26 | 19.23 | 17.64 | 17.64 | 17.64 | 17.64 | 17.64 |
| Inventories | 212.7 | 274.3 | 333.8 | 339.7 | 404.2 | 408.9 | 452.6 | 501.0 | 554.6 | 613.9 |
| Inventories, % | 22.77 | 25.78 | 27.45 | 27.24 | 28.92 | 26.43 | 26.43 | 26.43 | 26.43 | 26.43 |
| Accounts Payable | 96.5 | 116.9 | 142.5 | 133.2 | 149.4 | 168.3 | 186.3 | 206.3 | 228.3 | 252.7 |
| Accounts Payable, % | 10.33 | 10.99 | 11.71 | 10.68 | 10.69 | 10.88 | 10.88 | 10.88 | 10.88 | 10.88 |
| Capital Expenditure | -29.0 | -47.2 | -53.6 | -41.0 | -69.2 | -62.5 | -69.1 | -76.5 | -84.7 | -93.8 |
| Capital Expenditure, % | -3.1 | -4.43 | -4.41 | -3.29 | -4.96 | -4.04 | -4.04 | -4.04 | -4.04 | -4.04 |
| Tax Rate, % | 30.24 | 30.24 | 30.24 | 30.24 | 30.24 | 30.24 | 30.24 | 30.24 | 30.24 | 30.24 |
| EBITAT | 144.4 | 117.7 | 117.3 | 127.6 | 152.7 | 176.4 | 195.3 | 216.2 | 239.3 | 264.9 |
| Depreciation | ||||||||||
| Changes in Account Receivables | ||||||||||
| Changes in Inventories | ||||||||||
| Changes in Accounts Payable | ||||||||||
| Capital Expenditure | ||||||||||
| UFCF | -115.2 | 65.7 | 44.1 | 79.4 | 63.9 | 188.5 | 142.7 | 157.9 | 174.8 | 193.5 |
| WACC, % | 7.62 | 7.61 | 7.59 | 7.59 | 7.59 | 7.6 | 7.6 | 7.6 | 7.6 | 7.6 |
| PV UFCF | ||||||||||
| SUM PV UFCF | 689.8 | |||||||||
| Long Term Growth Rate, % | 2.00 | |||||||||
| Free cash flow (T + 1) | 197 | |||||||||
| Terminal Value | 3,524 | |||||||||
| Present Terminal Value | 2,443 | |||||||||
| Enterprise Value | 3,133 | |||||||||
| Net Debt | 157 | |||||||||
| Equity Value | 2,976 | |||||||||
| Diluted Shares Outstanding, MM | 8 | |||||||||
| Equity Value Per Share | 355.13 |
What You Will Receive
- Authentic Virbac Data: Comprehensive financials – from revenue to EBIT – derived from actual and projected data.
- Complete Customization: Modify all essential parameters (yellow cells) such as WACC, growth %, and tax rates.
- Instant Valuation Adjustments: Automatic recalculations to evaluate the effects of changes on Virbac's fair value.
- Flexible Excel Template: Designed for easy edits, scenario analysis, and in-depth forecasts.
- Efficient and Precise: Bypass the hassle of building models from the ground up while ensuring accuracy and adaptability.
Key Features
- Comprehensive DCF Calculator: Offers detailed unlevered and levered DCF valuation models tailored for Virbac SA (VIRPPA).
- WACC Calculator: Features a pre-built Weighted Average Cost of Capital sheet that allows for customizable inputs.
- Flexible Forecast Assumptions: Easily adjust growth rates, capital expenditures, and discount rates to fit your analysis.
- Integrated Financial Ratios: Evaluate profitability, leverage, and efficiency metrics specific to Virbac SA (VIRPPA).
- Visualization Dashboards and Charts: Provides visual summaries of essential valuation metrics for straightforward analysis.
How It Operates
- Step 1: Download the Excel file for Virbac SA (VIRPPA).
- Step 2: Examine the pre-filled financial data and forecasts provided for Virbac SA.
- Step 3: Adjust essential inputs such as revenue growth, WACC, and tax rates (highlighted cells).
- Step 4: Observe the DCF model refresh in real-time as you modify your assumptions.
- Step 5: Evaluate the results and utilize them for your investment strategies.
Why Choose This Calculator for Virbac SA (VIRPPA)?
- Precision: Based on actual Virbac financial data to ensure reliable results.
- Adaptability: Tailored for users to easily test and adjust various inputs.
- Efficiency: Eliminate the complexity of creating a DCF model from the ground up.
- High-Caliber: Crafted with the accuracy and usability standards expected at the CFO level.
- Intuitive: Simple interface that allows even beginners to navigate with ease.
Who Should Use This Product?
- Individual Investors: Make well-informed decisions about trading Virbac SA (VIRPPA) shares.
- Financial Analysts: Optimize valuation processes using comprehensive financial models tailored for Virbac SA (VIRPPA).
- Consultants: Provide clients with accurate and timely valuation insights related to Virbac SA (VIRPPA).
- Business Owners: Gain insights into the valuation methods of established firms like Virbac SA (VIRPPA) to refine your strategic approach.
- Finance Students: Explore valuation techniques with real-world data and case studies focused on Virbac SA (VIRPPA).
Contents of the Template
- Historical Data: Features Virbac SA’s previous financial performance and foundational forecasts.
- DCF and Levered DCF Models: Comprehensive templates for assessing the intrinsic value of Virbac SA (VIRPPA).
- WACC Sheet: Ready-made calculations for the Weighted Average Cost of Capital.
- Editable Inputs: Adjust pivotal parameters such as growth rates, EBITDA percentages, and CAPEX assumptions.
- Quarterly and Annual Statements: An in-depth analysis of Virbac SA’s financial data.
- Interactive Dashboard: Dynamically visualize valuation outcomes and forecasts.
Disclaimer
All information, articles, and product details provided on this website are for general informational and educational purposes only. We do not claim any ownership over, nor do we intend to infringe upon, any trademarks, copyrights, logos, brand names, or other intellectual property mentioned or depicted on this site. Such intellectual property remains the property of its respective owners, and any references here are made solely for identification or informational purposes, without implying any affiliation, endorsement, or partnership.
We make no representations or warranties, express or implied, regarding the accuracy, completeness, or suitability of any content or products presented. Nothing on this website should be construed as legal, tax, investment, financial, medical, or other professional advice. In addition, no part of this site—including articles or product references—constitutes a solicitation, recommendation, endorsement, advertisement, or offer to buy or sell any securities, franchises, or other financial instruments, particularly in jurisdictions where such activity would be unlawful.
All content is of a general nature and may not address the specific circumstances of any individual or entity. It is not a substitute for professional advice or services. Any actions you take based on the information provided here are strictly at your own risk. You accept full responsibility for any decisions or outcomes arising from your use of this website and agree to release us from any liability in connection with your use of, or reliance upon, the content or products found herein.