
|
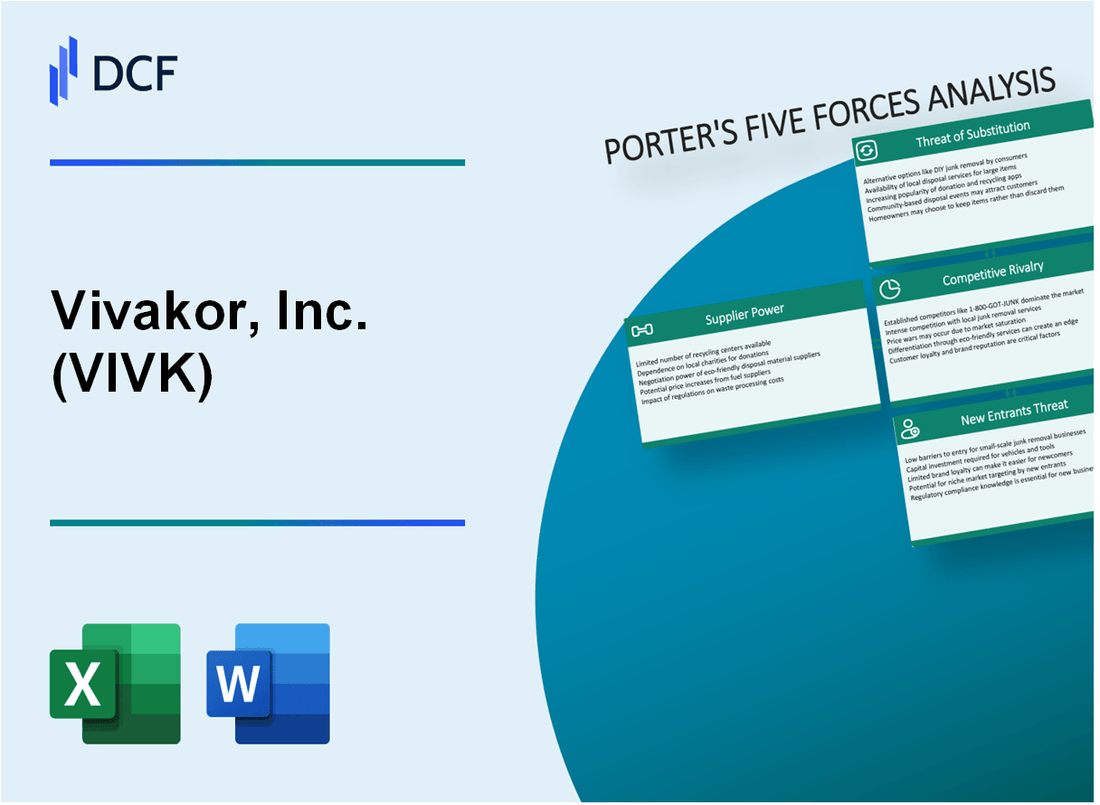
Vivakor, Inc. (VIVK): 5 FORCES Analysis [Nov-2025 Updated] |
Fully Editable: Tailor To Your Needs In Excel Or Sheets
Professional Design: Trusted, Industry-Standard Templates
Investor-Approved Valuation Models
MAC/PC Compatible, Fully Unlocked
No Expertise Is Needed; Easy To Follow
Vivakor, Inc. (VIVK) Bundle
You're digging into Vivakor, Inc., trying to figure out if that patented remediation technology is a game-changer or just a nice feature on a shaky foundation. Honestly, looking at the late 2025 picture, it's a classic tension: you have a proprietary moat, but you also have a company that posted a $9.0 million operating loss in Q3 and is trading with a market cap of just $22.7M as of November 2025. That financial volatility means every external pressure point matters immensely. So, before you make any calls, let's map out exactly where the power lies-with suppliers, customers, rivals, substitutes, and potential new entrants-because understanding these five forces tells us if Vivakor, Inc. can actually survive long enough to monetize that innovation.
Vivakor, Inc. (VIVK) - Porter's Five Forces: Bargaining power of suppliers
When you look at the supplier side of the equation for Vivakor, Inc. (VIVK), you see a mix of commodity exposure and reliance on specialized, proprietary technology providers. Honestly, the financial pressure from these groups is amplified by Vivakor, Inc.'s current operating performance.
The most immediate financial constraint you need to factor in is the bottom line. For the third quarter of 2025, Vivakor, Inc. reported an operating loss of $9.0 million. That kind of loss significantly limits your ability to push back on supplier price increases; you simply don't have the cash cushion to absorb unexpected cost hikes without jeopardizing operations.
Here is a breakdown of the key supplier forces impacting Vivakor, Inc. right now:
| Supplier Category | Power Level | Supporting Data/Context |
|---|---|---|
| Commodity Suppliers (Crude/LPG) | High | Vivakor, Inc. initiated its first major liquidity trade involving Liquid Petroleum Gas (LPG) valued at $23 million on November 10, 2025. This direct involvement in commodity trading exposes the company to volatile global pricing, giving commodity producers high leverage. |
| Specialized RPC Equipment Suppliers | Moderate | The core of Vivakor, Inc.'s technology is its patented Remediation Processing Centers (RPCs). While the technology is proprietary to Vivakor, Inc., the suppliers of the specialized components or the manufacturing capacity for new RPCs hold moderate power due to the unique, patented nature of the equipment needed. |
| Landowners/Governments (Contaminated Soil) | High | Securing feedstock-contaminated soil-is critical. For instance, a contract in Kuwait involved remediating 500,000 tons of soil. When dealing with site access and environmental regulations, the landowners or the governing bodies setting project terms hold significant leverage over contract structure and pricing. |
For commodity suppliers, the market reality is clear. Vivakor, Inc.'s recent move into LPG trading, a $23 million transaction as of November 2025, shows they are active in markets where pricing is set globally, not locally. That means the power rests with the producers and refiners, not the buyer.
Regarding the specialized RPC equipment, the power is moderate because the technology itself is patented and unique to Vivakor, Inc.'s process. However, the entities that build or supply the highly specific components for these RPCs-especially the two additional units slated for Houston-have leverage because there aren't many alternatives for those proprietary needs. If onboarding those specialized parts takes longer than expected, it directly impacts the planned Q1 2026 launch of the Houston Remediation Processing Center.
Finally, consider the source of the material for the remediation side of the business. When Vivakor, Inc. secures a contract like the one to process 500,000 tons of soil in Kuwait, the terms are heavily influenced by the local entity or government granting access to that material. The company provides the equipment and expertise, but the local partner, like Al Dali International Co. in that case, controls the resource itself, giving them high leverage on project economics.
Finance: draft 13-week cash view by Friday.
Vivakor, Inc. (VIVK) - Porter's Five Forces: Bargaining power of customers
You're analyzing Vivakor, Inc. (VIVK)'s customer dynamics as of late 2025. The power your customers hold over your pricing and terms is a critical lens for strategy, and it really depends on which segment you're looking at.
For the commodity side of the business-think crude oil trading and logistics-customers definitely have leverage. When you are dealing in products like crude, market price transparency is nearly instant. If you aren't competitive on the day's going rate, that buyer can pivot to the next supplier pretty fast. This is reflected in the Supply and Trading segment, which brought in $8.9 million of the total Q3 2025 revenue. Honestly, in that space, you are price-takers unless you have a unique logistical advantage.
However, Vivakor, Inc. (VIVK) has successfully deployed long-term agreements to lock in demand and blunt that commodity price pressure. The most notable example is the 10-year contract signed to sell asphaltic binder recovered from its RPCs (Remediation Processing Centers). At the time it was announced, this deal was structured for up to $30 million per year at then-current prices. A contract of that duration significantly reduces the bargaining power of that specific customer base, as it guarantees a floor for that product line for a decade.
For your remediation services, the dynamic shifts entirely toward higher switching costs for the customer. Once Vivakor, Inc. (VIVK) deploys its patented RPC technology on a site for a government or oil company client, the investment in setting up the process, integrating the output streams, and meeting regulatory sign-offs creates significant friction for that customer to switch providers mid-project. We see evidence of this lock-in strategy in recent deal structures; for instance, a late 2025 term sheet included a three-year exclusive commitment from a counterparty to use Vivakor, Inc. (VIVK)'s trucking fleet in the Permian and Eagle Ford Basins, which directly supports the remediation segment's throughput. That kind of multi-year commitment is a powerful barrier to customer defection.
Still, you have to watch for sales channel concentration. When a significant portion of revenue comes from related parties, it suggests a smaller pool of independent buyers, which can concentrate power among those few. In Q3 2025, related-party revenue totaled $3.92 million. To give you the full picture of that quarter's revenue mix, here is the breakdown:
| Revenue Segment | Q3 2025 Revenue (USD) |
| Supply and Trading | $8.9 million |
| Transportation and Logistics (Total) | $4.7 million |
| Transportation and Logistics (related party) | $2.5 million |
| Terminaling and Storage (related party) | $0.9 million |
The total revenue for Q3 2025 was $17.0 million. The related-party figures, $2.5 million and $0.9 million, sum to $3.4 million, which is close to the $3.92 million figure cited, showing that a notable chunk of the business is tied up in these internal or affiliated channels. You need to keep pushing for new, independent, long-term remediation contracts to diversify away from the commodity price exposure and the concentration risk from related sales channels.
Vivakor, Inc. (VIVK) - Porter's Five Forces: Competitive rivalry
You're looking at Vivakor, Inc. (VIVK) in the context of intense industry competition, and the numbers definitely tell a story of a small player in a big arena. The competitive rivalry here is shaped by the fragmented nature of the midstream, trading, and environmental services sectors Vivakor, Inc. operates in.
Vivakor, Inc.'s small Market Cap of $22.7M as of November 2025 immediately signals vulnerability. Honestly, that size means larger, integrated firms can easily outmaneuver you on capital expenditure or contract bidding. The company's trailing 12-month revenue as of June 30, 2025, stood at $124M, yet its market valuation remains tiny compared to established players.
Rivalry is particularly fierce in the transportation and logistics segment, which, to be fair, is typically a low-margin business. Look at the Q1 2025 results: revenue hit $37.3 million, but the resulting gross margin was only 12.7%. This thin margin structure amplifies the pressure from competitors who can achieve better economies of scale.
Still, Vivakor, Inc. has a potential differentiator. The proprietary RPC technology provides a temporary competitive moat in remediation. This patented process is designed to clean soils with more than 5% by weight oil contamination while recovering the oil, leaving the soil with Total Petroleum Hydrocarbons (TPH) below 1%. Market share estimates in this niche sector are challenging, but Vivakor, Inc. held likely less than 1% of the broader environmental services market based on 2024 operational scale.
Here's a quick look at the recent operational swings that highlight the volatility within this competitive environment:
| Metric | Q1 2025 (Ended Mar 31, 2025) | Q3 2025 (Ended Sep 30, 2025) |
| Revenue | $37.3 million | $16.98 million |
| Gross Profit | $4.8 million | N/A (Not explicitly reported for Q3) |
| Gross Margin | 12.7% | N/A (Not explicitly reported for Q3) |
| Earnings (Net Loss) | -$7.5 million (Net Loss) | -$36.0M (Q3 Earnings) |
The competitive dynamics are further defined by the structure of Vivakor, Inc.'s operations:
- Competition spans midstream, trading, and environmental services.
- Small market cap of $22.7M (Nov 2025) is a size disadvantage.
- Rivalry intense in low-margin transportation/logistics.
- Proprietary RPC technology offers a temporary moat.
- Q1 2025 gross margin was 12.7%.
- TTM Earnings ending Sep 30, 2025, were -$75.3M.
What this estimate hides is the dependency on securing and scaling projects that utilize the RPC technology effectively against established, larger remediation firms. Finance: draft 13-week cash view by Friday.
Vivakor, Inc. (VIVK) - Porter's Five Forces: Threat of substitutes
You're analyzing Vivakor, Inc. (VIVK) and need a clear picture of what stands in the way of its core products and services. The threat of substitutes is real here, as several established, large-scale industries offer alternatives to Vivakor's specialized offerings in bitumen processing and environmental remediation.
For Vivakor's bitumen product line, the primary substitute is traditional asphalt production. As of March 2025, the national average for hot-mix asphalt material was between $100 to $200 per ton (cite: 3). To be fair, this is a broad range, and specialized products like Polymer Liquid Asphalt in New Jersey were priced much higher at $722.00 per ton in March 2025 (cite: 3). Still, the existence of a massive, established market with recycled asphalt available for as low as $10 to $20 per ton (cite: 3) presents a constant, lower-cost alternative for certain applications.
When looking at Vivakor's environmental remediation services, the established methods of landfilling and incineration pose a significant threat. Landfilling Municipal Solid Waste (MSW) has a national average tipping fee in 2024 of $62.28 per ton (cite: 1), with larger facilities charging over $70 per ton (cite: 1). In contrast, hazardous waste incineration costs are substantially higher; on-site incineration can range from $71 to $600 per ton (cite: 7), and the full process of excavation, transport, and disposal for hazardous waste is estimated between $270 to $460 per ton (cite: 7). These established disposal routes are well-understood by clients, even if they are more expensive for certain waste streams.
Vivakor's involvement in crude oil logistics also faces substitution pressure from massive, existing infrastructure. The volume of crude oil transported via pipelines in the U.S. is projected to increase by roughly 2.3% from 2024 to 2025 (cite: 9). For context, the U.S. crude production is forecast to average 13.7 million barrels per day (bpd) in 2025 (cite: 6), and major midstream operators logged record crude pipeline volumes of 16.5 million b/d in the fourth quarter of the previous year (cite: 18). This sheer scale of existing pipeline networks and large-scale storage facilities-like the commercial inventories that saw refinery inputs hit 16.2 million barrels per day for the week ending November 14, 2025 (cite: 13)-demonstrates the entrenched nature of the substitute infrastructure.
The relative scale of Vivakor, Inc. (VIVK) compared to these substitute markets is a key factor in assessing this force. Vivakor's TTM revenue of $124 million is small compared to major energy substitutes. To put that in perspective against the remediation market, the national average MSW landfill tipping fee alone, if applied to a large volume, represents a market far exceeding Vivakor's total revenue base.
Here is a quick comparison of the cost structures of the established substitutes:
| Substitute Method/Product | Unit of Measure | Reported 2025/2024 Cost/Volume Data |
| Hot-Mix Asphalt (National Average Material) | Per Ton | $100 to $200 (cite: 3) |
| Recycled Asphalt Material | Per Ton | $10 to $20 (cite: 3) |
| MSW Landfill Tipping Fee (National Average) | Per Ton | $62.28 (cite: 1) |
| Hazardous Waste Incineration (On-site Range) | Per Ton | $71 to $600 (cite: 7) |
| Crude Oil Pipeline Transport Volume Growth (2024 to 2025) | Percentage Change | Approx. 2.3% increase (cite: 9) |
The threat is amplified by the following characteristics of these substitutes:
- Traditional asphalt prices are directly tied to crude oil price fluctuations.
- Landfill tipping fees are tracking closely with the Consumer Price Index (CPI).
- Pipeline capacity expansion is actively addressing production constraints in key basins.
- Incineration costs vary widely based on the specific hazardous material class.
Vivakor, Inc. (VIVK) - Porter's Five Forces: Threat of new entrants
You're looking at who might try to muscle in on Vivakor, Inc.'s turf, and honestly, the barriers to entry here are pretty steep, especially if a new player wants to compete on the same technological or asset-heavy level. It's not just about having the know-how; it's about having the legal protection and the sheer amount of cash ready to deploy.
The first line of defense for Vivakor, Inc. is its intellectual property. The company's proprietary Remediation Processing Center (RPC) technology is patented. This isn't just a slight process improvement; it's a unique clean-tech approach designed to extract valuable hydrocarbons from things like oil sands and contaminated soils, leaving both the soil and the oil intact for reuse. If you can't legally use that specific process, you're stuck with older, potentially less efficient, or more costly methods. That patent creates a definite legal moat.
Next up, let's talk about the hardware and infrastructure needed. Entering this space requires significant capital expenditure, particularly for the midstream assets that Vivakor, Inc. uses to support its operations. We're talking about terminals, storage facilities, and a dedicated trucking fleet to move the materials around. To give you a sense of the capital required just to support the trading side, Vivakor, Inc. recently closed a $40 million commodity intermediation credit facility in October 2025 to bolster its crude oil trading platform, which relies on these physical assets. That kind of financing commitment signals the scale of investment needed just to play in the logistics and storage part of the business, let alone building out the RPC units themselves.
Securing the work itself is another major hurdle. New entrants need to prove they can handle massive, long-term remediation projects, which often have government or international backing. Look at Vivakor, Inc.'s history in Kuwait, which stems from a United Nations-sponsored clean-up effort. They secured a long-term contract to clean 433k tons of soil, with earlier phases involving 15,000 metric tons for an initial value of about $2 million. The entire Kuwait Environmental Remediation Program (KERP) is estimated at approximately 26 million cubic meters of material. Landing a contract of that magnitude, especially one that requires deploying patented technology on-site, is a massive hurdle that favors established players with proven execution records.
The required capital base acts as a floor for any serious competitor. You need a balance sheet that can support the asset acquisition and operational scale. While the company's total assets were reported at $160.1 million at one point, reflecting the asset base required for this type of operation, the latest Q1 2025 figures show total assets climbing to $248.2 million. Here's a quick look at the asset scale that sets the entry point:
| Metric | Amount (Millions USD) | Context/Date Reference |
| Total Assets (Required Outline Figure) | $160.1 | Reference Figure |
| Total Assets (Latest Reported Q1 2025) | $248.2 | Q1 2025 |
| Commodity Intermediation Facility | $40.0 | Credit facility for trading/logistics expansion (Oct 2025) |
So, to summarize the barriers, a new firm needs to overcome proprietary patents, secure tens of millions in CapEx for midstream infrastructure, and successfully bid for and execute on multi-million-ton, politically sensitive contracts. It's a tough field to break into without serious backing.
Disclaimer
All information, articles, and product details provided on this website are for general informational and educational purposes only. We do not claim any ownership over, nor do we intend to infringe upon, any trademarks, copyrights, logos, brand names, or other intellectual property mentioned or depicted on this site. Such intellectual property remains the property of its respective owners, and any references here are made solely for identification or informational purposes, without implying any affiliation, endorsement, or partnership.
We make no representations or warranties, express or implied, regarding the accuracy, completeness, or suitability of any content or products presented. Nothing on this website should be construed as legal, tax, investment, financial, medical, or other professional advice. In addition, no part of this site—including articles or product references—constitutes a solicitation, recommendation, endorsement, advertisement, or offer to buy or sell any securities, franchises, or other financial instruments, particularly in jurisdictions where such activity would be unlawful.
All content is of a general nature and may not address the specific circumstances of any individual or entity. It is not a substitute for professional advice or services. Any actions you take based on the information provided here are strictly at your own risk. You accept full responsibility for any decisions or outcomes arising from your use of this website and agree to release us from any liability in connection with your use of, or reliance upon, the content or products found herein.