
|
VOC Energy Trust (VOC) DCF Valuation |
Fully Editable: Tailor To Your Needs In Excel Or Sheets
Professional Design: Trusted, Industry-Standard Templates
Investor-Approved Valuation Models
MAC/PC Compatible, Fully Unlocked
No Expertise Is Needed; Easy To Follow
VOC Energy Trust (VOC) Bundle
Evaluate VOC Energy Trust's financial outlook like an expert! This (VOC) DCF Calculator comes with pre-filled financial data and offers you the complete flexibility to modify revenue growth, WACC, margins, and other critical assumptions to align with your predictions.
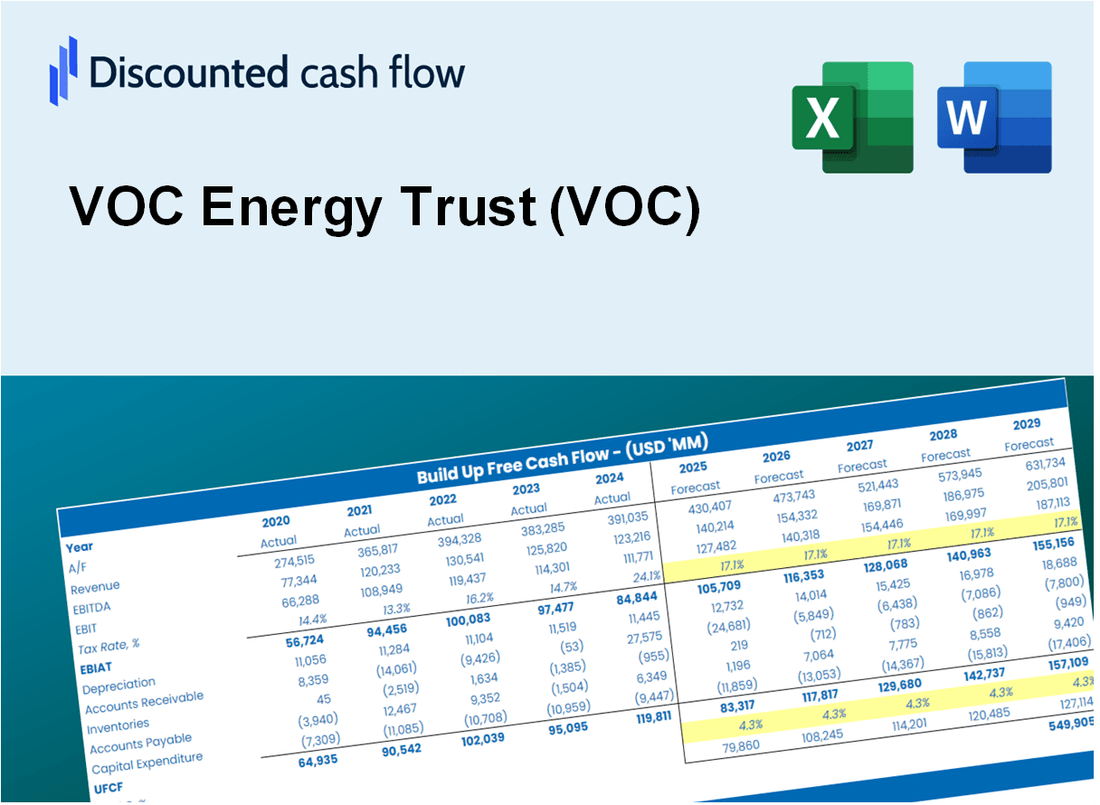
Discounted Cash Flow (DCF) - (USD MM)
| Year | AY1 2020 |
AY2 2021 |
AY3 2022 |
AY4 2023 |
AY5 2024 |
FY1 2025 |
FY2 2026 |
FY3 2027 |
FY4 2028 |
FY5 2029 |
|---|---|---|---|---|---|---|---|---|---|---|
| Revenue | 5.0 | 9.3 | 23.6 | 16.5 | 13.6 | 18.3 | 24.7 | 33.2 | 44.7 | 60.2 |
| Revenue Growth, % | 0 | 85.81 | 153.64 | -30.24 | -17.24 | 34.59 | 34.59 | 34.59 | 34.59 | 34.59 |
| EBITDA | 3.8 | 9.3 | 23.6 | 15.2 | 12.4 | 16.9 | 22.7 | 30.5 | 41.1 | 55.3 |
| EBITDA, % | 76.4 | 100 | 100 | 92.44 | 91.1 | 91.99 | 91.99 | 91.99 | 91.99 | 91.99 |
| Depreciation | .0 | .6 | 1.9 | .0 | .0 | .5 | .7 | 1.0 | 1.3 | 1.8 |
| Depreciation, % | 0 | 6.8 | 8.13 | 0 | 0 | 2.99 | 2.99 | 2.99 | 2.99 | 2.99 |
| EBIT | 3.8 | 8.7 | 21.7 | 15.2 | 12.4 | 16.3 | 22.0 | 29.6 | 39.8 | 53.5 |
| EBIT, % | 76.4 | 93.2 | 91.87 | 92.44 | 91.1 | 89 | 89 | 89 | 89 | 89 |
| Total Cash | .6 | .3 | 1.2 | 1.4 | 1.7 | 1.5 | 2.1 | 2.8 | 3.7 | 5.0 |
| Total Cash, percent | .0 | .0 | .0 | .0 | .0 | .0 | .0 | .0 | .0 | .0 |
| Account Receivables | .0 | .0 | .0 | .0 | .0 | .0 | .0 | .0 | .0 | .0 |
| Account Receivables, % | 0 | 0 | 0 | 0 | 0 | 0 | 0 | 0 | 0 | 0 |
| Inventories | .0 | .0 | .0 | .0 | .0 | .0 | .0 | .0 | .0 | .0 |
| Inventories, % | 0 | 0 | 0 | 0 | 0 | 0 | 0 | 0 | 0 | 0 |
| Accounts Payable | .0 | .0 | .0 | .0 | .0 | .0 | .0 | .0 | .0 | .0 |
| Accounts Payable, % | 0 | 0 | 0 | 0 | 0 | 0 | 0 | 0 | 0 | 0 |
| Capital Expenditure | .0 | .0 | .0 | .0 | .0 | .0 | .0 | .0 | .0 | .0 |
| Capital Expenditure, % | 0 | 0 | 0 | 0 | 0 | 0 | 0 | 0 | 0 | 0 |
| Tax Rate, % | 0 | 0 | 0 | 0 | 0 | 0 | 0 | 0 | 0 | 0 |
| EBITAT | 3.8 | 8.7 | 21.7 | 15.2 | 12.4 | 16.3 | 22.0 | 29.6 | 39.8 | 53.5 |
| Depreciation | ||||||||||
| Changes in Account Receivables | ||||||||||
| Changes in Inventories | ||||||||||
| Changes in Accounts Payable | ||||||||||
| Capital Expenditure | ||||||||||
| UFCF | 3.8 | 9.3 | 23.6 | 15.2 | 12.4 | 16.9 | 22.7 | 30.5 | 41.1 | 55.3 |
| WACC, % | 5.07 | 5.07 | 5.07 | 5.07 | 5.07 | 5.07 | 5.07 | 5.07 | 5.07 | 5.07 |
| PV UFCF | ||||||||||
| SUM PV UFCF | 139.9 | |||||||||
| Long Term Growth Rate, % | 2.00 | |||||||||
| Free cash flow (T + 1) | 56 | |||||||||
| Terminal Value | 1,838 | |||||||||
| Present Terminal Value | 1,435 | |||||||||
| Enterprise Value | 1,575 | |||||||||
| Net Debt | -2 | |||||||||
| Equity Value | 1,577 | |||||||||
| Diluted Shares Outstanding, MM | 17 | |||||||||
| Equity Value Per Share | 92.75 |
What You Will Get
- Genuine VOC Data: Preloaded financials – encompassing revenue to EBIT – derived from actual and projected figures for VOC Energy Trust (VOC).
- Complete Customization: Modify all essential parameters (yellow cells) such as WACC, growth %, and tax rates to fit your analysis.
- Immediate Valuation Updates: Automatic recalculations to assess the effects of changes on VOC’s fair value.
- Flexible Excel Template: Designed for quick modifications, scenario analysis, and comprehensive projections.
- Efficient and Precise: Avoid the hassle of building models from the ground up while ensuring accuracy and adaptability.
Key Features
- Accurate Financial Data: Gain access to reliable pre-loaded historical figures and future forecasts for VOC Energy Trust (VOC).
- Adjustable Forecast Parameters: Modify highlighted fields such as WACC, growth rates, and profit margins to suit your analysis.
- Real-Time Calculations: Instant updates for DCF, Net Present Value (NPV), and cash flow evaluations.
- User-Friendly Dashboard: Clear and concise charts and summaries to help you interpret your valuation findings.
- Suitable for All Levels: Designed with a straightforward interface for investors, CFOs, and consultants alike.
How It Works
- Step 1: Download the Excel file.
- Step 2: Review pre-entered VOC Energy Trust (VOC) data (historical and projected).
- Step 3: Adjust key assumptions (yellow cells) based on your analysis.
- Step 4: View automatic recalculations for VOC Energy Trust’s intrinsic value.
- Step 5: Use the outputs for investment decisions or reporting.
Why Choose the VOC Energy Trust (VOC) Calculator?
- Accuracy: Utilizes real VOC Energy Trust financial data for precise calculations.
- Flexibility: Allows users to easily test and adjust inputs according to their needs.
- Time-Saving: Avoid the complexities of creating a financial model from the ground up.
- Professional-Grade: Crafted with the expertise and precision expected at the CFO level.
- User-Friendly: Designed for ease of use, suitable for individuals without extensive financial modeling skills.
Who Should Use VOC Energy Trust (VOC)?
- Institutional Investors: Develop comprehensive valuation frameworks for energy sector investments.
- Energy Analysts: Evaluate market trends and valuation models to inform strategic decisions.
- Financial Advisors: Offer clients informed insights on the performance and valuation of VOC Energy Trust (VOC).
- Students and Researchers: Leverage real-time data for academic projects and financial modeling exercises.
- Energy Sector Enthusiasts: Gain insights into the valuation processes of energy trusts like VOC Energy Trust (VOC).
What the Template Contains
- Preloaded VOC Data: Historical and projected financial data, including revenue, EBIT, and capital expenditures.
- DCF and WACC Models: Professional-grade sheets for calculating intrinsic value and Weighted Average Cost of Capital.
- Editable Inputs: Yellow-highlighted cells for adjusting revenue growth, tax rates, and discount rates.
- Financial Statements: Comprehensive annual and quarterly financials for deeper analysis.
- Key Ratios: Profitability, leverage, and efficiency ratios to evaluate performance.
- Dashboard and Charts: Visual summaries of valuation outcomes and assumptions.
Disclaimer
All information, articles, and product details provided on this website are for general informational and educational purposes only. We do not claim any ownership over, nor do we intend to infringe upon, any trademarks, copyrights, logos, brand names, or other intellectual property mentioned or depicted on this site. Such intellectual property remains the property of its respective owners, and any references here are made solely for identification or informational purposes, without implying any affiliation, endorsement, or partnership.
We make no representations or warranties, express or implied, regarding the accuracy, completeness, or suitability of any content or products presented. Nothing on this website should be construed as legal, tax, investment, financial, medical, or other professional advice. In addition, no part of this site—including articles or product references—constitutes a solicitation, recommendation, endorsement, advertisement, or offer to buy or sell any securities, franchises, or other financial instruments, particularly in jurisdictions where such activity would be unlawful.
All content is of a general nature and may not address the specific circumstances of any individual or entity. It is not a substitute for professional advice or services. Any actions you take based on the information provided here are strictly at your own risk. You accept full responsibility for any decisions or outcomes arising from your use of this website and agree to release us from any liability in connection with your use of, or reliance upon, the content or products found herein.