
|
Vertiv Holdings Co (VRT): ANSOFF MATRIX [Dec-2025 Updated] |
Fully Editable: Tailor To Your Needs In Excel Or Sheets
Professional Design: Trusted, Industry-Standard Templates
Investor-Approved Valuation Models
MAC/PC Compatible, Fully Unlocked
No Expertise Is Needed; Easy To Follow
Vertiv Holdings Co (VRT) Bundle
You're looking for a clear-eyed view of Vertiv Holdings Co's growth path, and honestly, their biggest near-term challenge isn't finding demand-it's executing on the massive $10.2 billion net sales guidance for 2025, fueled by that $9.5 billion backlog. As a former head analyst, I see their strategy clearly mapped across the Ansoff Matrix: it's heavy on Market Penetration right now, aiming to hit that 25% adjusted operating margin target by clearing that order book and using their doubled capacity. But don't miss the future moves, like pushing AI-ready gear from the Great Lakes acquisition and exploring microgrid partnerships with Caterpillar; these Product Development and Diversification plays are what will sustain the momentum seen in their Q3 organic order growth of 60%. Let's break down exactly how Vertiv Holdings Co plans to nail these execution targets and pivot toward new markets below.
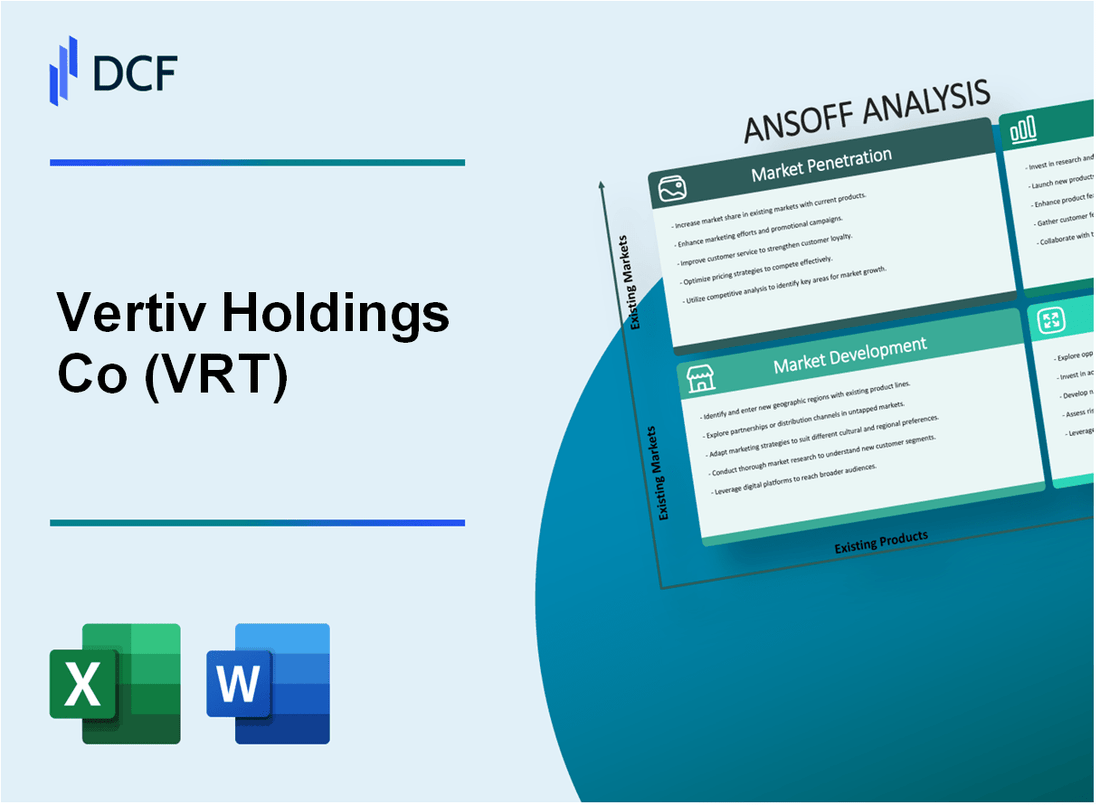
Vertiv Holdings Co (VRT) - Ansoff Matrix: Market Penetration
You're looking at how Vertiv Holdings Co is maximizing sales within its current core markets, which is the essence of market penetration. It's about selling more of what you already make to the customers you already know, and the numbers from the third quarter of 2025 show serious traction here.
The immediate focus is on clearing the massive order book. Vertiv Holdings Co ended the third quarter of 2025 with a backlog standing at \$9.5 billion. This backlog represents a 30% increase year-over-year. Fulfillment of this volume, especially for hyperscalers, is the primary near-term operational goal.
To handle this demand, Vertiv Holdings Co is actively scaling its operational footprint. Management confirmed they are accelerating investments in manufacturing and services capacity globally, with a significant focus on the Americas. While a specific doubling of capacity isn't quantified, the investment strategy is designed to keep them 6 to 12 months ahead of demand curves.
Pricing power is showing through in the margin performance, even with tariff headwinds. The adjusted operating margin for the third quarter of 2025 hit 22.3%, which is an improvement of 220 basis points compared to the third quarter of 2024. The year-over-year incremental margin achieved in that quarter was approximately 30%. The long-term aspiration remains the adjusted operating margin target of 25% by 2029. For the full year 2025, the company raised guidance to an adjusted operating margin midpoint of 20.2%.
Deepening sales within existing client segments is clearly working, evidenced by the order intake. Third quarter 2025 organic orders increased by approximately 60% year-over-year, and orders were up 20% sequentially from the second quarter of 2025. The Americas region was a standout, showing 43% organic sales growth in the third quarter. The Trailing Twelve Month (TTM) organic orders growth was 21%.
The service arm is being positioned for higher-margin capture. In the first quarter of 2025, service revenues grew 4.7% year-over-year, making up 19% of total revenues, with service and spares revenue in the Americas growing 8.7% year-over-year. Management reiterated that services are a "superpower," with field engineer headcount scaling to between 4,400 and 4,500.
Here's a quick look at some of the key performance metrics from the third quarter of 2025:
| Metric | Value | Period/Context |
| Backlog | \$9.5 billion | End of Q3 2025 |
| Q3 Organic Orders Growth | ~60% | Year-over-Year (Q3 2025) |
| Q3 Adjusted Operating Margin | 22.3% | Q3 2025 |
| Americas Organic Sales Growth | 43% | Year-over-Year (Q3 2025) |
| Full Year 2025 Adjusted Operating Margin Guidance (Midpoint) | 20.2% | Full Year 2025 |
| Long-Term Adjusted Operating Margin Target | 25% | By 2029 |
The momentum is also reflected in the book-to-bill ratio, which was approximately 1.4x in the third quarter. This indicates that new business is coming in faster than current revenue recognition.
The service component's contribution is growing, as seen in the first quarter of 2025:
- Service revenues grew 4.7% year-over-year in Q1 2025.
- Service revenues accounted for 19% of total Q1 2025 revenues.
- Service & spares revenues in the Americas grew 8.7% year-over-year in Q1 2025.
- Field engineer headcount is scaling to between 4,400-4,500.
Finance: finalize the Q4 2025 capacity utilization forecast by next Tuesday.
Vertiv Holdings Co (VRT) - Ansoff Matrix: Market Development
You're looking at how Vertiv Holdings Co is pushing its existing products into new markets or geographies, which is the essence of Market Development in the Ansoff Matrix.
Vertiv Holdings Co is targeting the expansion of its existing UPS and rack solutions into the broader enterprise and edge computing segments. This is a direct response to the trend where AI use is expanding beyond early cloud and colocation providers to impact Enterprise data centers, which now require the same advanced power and cooling Vertiv offers.
For the slower-growing EMEA region, the focus is on driving growth through internal adjustments. In the second quarter of 2025, EMEA sales showed growth of 7%. Management has acknowledged execution challenges in EMEA related to fixed-cost investments and supply chain shifts, leading to a plan where they have accelerated a restructuring program in the region. The expectation is that operational initiatives, tariff countermeasures, and strategic supply chain optimization efforts will lead to sequential margin improvement throughout the remainder of 2025.
The geographic reach of the new Vertiv OneCore prefabricated modular solutions is being expanded through a global availability announcement on August 5, 2025. This turn-key solution, which integrates power, thermal, and IT infrastructure, is designed for various deployments, including enterprise, colocation, sovereign, and neocloud environments. The design supports scalable power capacity from 5 to 50 MW in a single block and is configurable for 96 to 944 racks.
The strategy involves using the performance in the Americas as a model for other areas. In the second quarter of 2025, the Americas (AMER) segment delivered impressive organic sales growth of 42.9%, achieving an adjusted operating margin of 24%. This strong regional performance serves as the blueprint for accelerating growth elsewhere, especially as the company works through EMEA challenges.
Vertiv Holdings Co is also looking to introduce its existing thermal management products into markets outside of the core data center space. Vertiv Holdings Co is generally a provider for commercial and industrial environments, in addition to data centers. The broader Thermal Management Technologies Market, which includes these other sectors, is projected to reach USD 27.50 Billion by 2032.
Here are some key financial and operational metrics supporting this Market Development strategy:
| Metric | Value (2025 Data) | Context |
|---|---|---|
| Full Year 2025 Net Sales Guidance (High End) | $10.24 billion | Latest raised guidance |
| Full Year 2025 Organic Sales Growth Forecast | 24% to 28% | Range across different guidance updates |
| Q2 2025 Americas Organic Sales Growth | 42.9% | Strong regional performance |
| Q2 2025 EMEA Organic Sales Growth | 7% | Slower growth area targeted for improvement |
| Q3 2025 Backlog | $9.5 billion | Indicates strong future revenue visibility |
The Market Development focus relies on leveraging existing product strengths across these areas:
- Targeting enterprise and edge computing with established UPS and rack solutions.
- Driving EMEA growth via an accelerated restructuring program.
- Expanding Vertiv OneCore globally to enterprise and colocation customers.
- Using the 42.9% AMER growth as a benchmark.
- Applying thermal management expertise to commercial and industrial environments.
The company's Q2 2025 adjusted operating profit was $489.3 million, up 28% year-on-year, showing the leverage from existing product sales in high-growth areas. The backlog stood at $8.5 billion at the end of Q2 2025, supporting a multi-quarter trajectory.
Vertiv Holdings Co (VRT) - Ansoff Matrix: Product Development
You're looking at how Vertiv Holdings Co (VRT) is pushing new products into the market, which is the Product Development quadrant of the Ansoff Matrix. This is where the real investment in future growth happens, especially in the AI space. Honestly, the moves they are making show they are serious about owning the infrastructure layer for next-generation compute.
The acquisition of the Great Lakes Data Racks & Cabinets family of companies for \$200 million is a prime example of this. This deal, which represents approximately 11.5x the expected 2026 EBITDA including synergies, directly feeds into the strategy of pushing new AI-ready rack solutions to existing customers. It strengthens Vertiv Holdings Co's position in the critical white space market by adding high-end rack solutions and innovation capabilities essential for high-density AI infrastructure.
Vertiv Holdings Co is also commercializing its gigawatt-scale reference architectures developed with NVIDIA. These blueprints, designed for the NVIDIA Omniverse DSX Blueprint, aim to compress delivery schedules by up to 50% compared to conventional construction methods, helping customers accelerate their Time to First Token. The prefabricated variant of these architectures is built on the Vertiv OneCore platform, which treats the entire facility as a single, co-designed system.
Here's a quick look at the scale of the infrastructure Vertiv Holdings Co is now designing for:
| Metric | Value/Target | Context |
| Time to First Token Reduction | Up to 50% | Via gigawatt-scale reference architectures with NVIDIA |
| Vertiv OneCore Platform Benefit | Compresses delivery schedules by up to 50% | Compared to traditional construction |
| Rack Density Supported (CoolChip CDU 100) | Up to 100 kW | Direct-to-chip liquid cooling solution |
| Rack Density Supported (CoolChip CDU 600) | 600 kW | In-row, liquid-to-liquid model for hyperscale |
To manage the extreme thermal loads from these high-density AI workloads, Vertiv Holdings Co is scaling up liquid cooling capacity. We know that standard AI racks are pushing past 30 kW, with some reaching up to 120 kW or higher, so this capacity expansion is non-negotiable for operational continuity.
The integration of Purge Rite is another major product development play, focused on services that enhance margins. Vertiv Holdings Co agreed to acquire Purge Rite for approximately \$1.0 billion in cash, with an additional potential consideration of up to \$250 million based on 2026 performance metrics. This deal is expected to be margin accretive to Vertiv Holdings Co's Services business, which already operates above corporate average margins, by integrating specialized mechanical flushing, purging, and filtration expertise for liquid cooling systems.
Finally, the company is heavily investing in future power technology. Vertiv Holdings Co is accelerating R&D by over 20% for 2026 to stay ahead of the compute curve. This investment is directly tied to the planned launch of the 800-volt DC power portfolio in the second half of 2026 ($\text{H2 2026}$).
This $\text{800 VDC}$ portfolio is strategically timed to align with NVIDIA's 2027 Rubin Ultra platforms, ensuring Vertiv Holdings Co is ready for megawatt-scale rack densities that traditional $\text{54 VDC}$ systems cannot efficiently handle. The readiness for this shift is supported by a global service organization of over 4,000 field service engineers.
The overall financial health supports these moves; for the quarter ending September 30, 2025, Vertiv Holdings Co reported revenue of approximately \$2.68 billion and an EBIT margin of 15.7%. This operational strength underpins the capital deployment into these product-focused growth vectors.
Key product development initiatives include:
- Pushing AI-ready racks from the \$200 million Great Lakes acquisition.
- Commercializing gigawatt-scale reference architectures with NVIDIA.
- Integrating Purge Rite expertise to boost service margins.
- Scaling liquid cooling to support racks exceeding 120 kW.
- Investing R&D (over 20% increase) for the H2 2026 $\text{800 VDC}$ launch.
Finance: draft $\text{13-week}$ cash view by Friday.
Vertiv Holdings Co (VRT) - Ansoff Matrix: Diversification
Vertiv Holdings Co is actively pursuing diversification by moving beyond its core data center cooling and power business into adjacent energy and infrastructure markets. This strategy is supported by recent financial strength, with total revenue for the last year reported at $8.01B USD and Q3 2025 operating revenue reaching $2.68B. The company maintains a healthy gross margin of 35.7%.
The partnership with Caterpillar Inc., announced in November 2025, directly addresses the need for integrated, on-site energy solutions, which is a key diversification vector. This collaboration combines Vertiv Holdings Co's power and cooling portfolio with Caterpillar's power generation expertise, including its subsidiary Solar Turbines. Caterpillar, which reported 2024 sales and revenues of $64.8 billion, will supply solutions for power generation and CCHP (Combined Cooling, Heat, and Power). This joint effort forms a 'cornerstone' of Vertiv Holdings Co's Bring Your Own Power & Cooling (BYOP&C) strategy, aiming to reduce reliance on the public grid.
To build out capabilities in adjacent high-growth sectors, Vertiv Holdings Co has been active on the Mergers and Acquisitions front. The company made a significant move by acquiring Purge Rite for a reported $1B. Furthermore, Vertiv Holdings Co has completed a total of 8 acquisitions across 5 sectors as of September 2025.
The acquisition of Great Lakes Data Racks & Cabinets in July/August 2025 for $200 million exemplifies strengthening its integrated infrastructure offerings outside of pure power/cooling systems.
| Acquisition Target | Purchase Price (USD) | Primary Benefit | Manufacturing Footprint Expansion |
| Great Lakes Data Racks & Cabinets | $200 million | Strengthen leadership in high-density integrated infrastructure for AI-ready rack solutions | Manufacturing and assembly facilities in the United States and Europe |
| Purge Rite | $1B | Enhance service margins through cost synergies; reinforce liquid cooling capabilities | Not specified in detail |
Targeting non-data center infrastructure represents a significant diversification play, particularly in the telecom sector. The market is currently underestimating Vertiv Holdings Co's opportunity in this area, estimated at $18.6 billion for telecom retrofits. This is driven by the fact that 77.5% of 4G sites still require upgrading, while 5G power consumption demands are 2-3x higher.
The focus on services and non-core infrastructure is projected to yield substantial returns, with Vertiv Holdings Co expecting 15-20% annual growth in service revenue, targeting over $2B+ in service revenue by 2027-2028. This aligns with the company's existing capacity expansion, where switchgear, busway, and integrated modular solutions (IMS) capacity has already increased by over 100% since 2021 and is forecast to double again by the end of 2025.
- The Americas region currently accounts for $4.56B of Vertiv Holdings Co's revenue from the prior year.
- The United States alone contributed 51.00% of total revenue, amounting to $4.09B.
- The company's current backlog stands at $7.2B.
- Vertiv Holdings Co expects a 44% increase in FY2025 EPS based on robust order growth.
- The new Caterpillar alliance aims to lower Power Usage Effectiveness (PUE) through end-to-end optimization.
Disclaimer
All information, articles, and product details provided on this website are for general informational and educational purposes only. We do not claim any ownership over, nor do we intend to infringe upon, any trademarks, copyrights, logos, brand names, or other intellectual property mentioned or depicted on this site. Such intellectual property remains the property of its respective owners, and any references here are made solely for identification or informational purposes, without implying any affiliation, endorsement, or partnership.
We make no representations or warranties, express or implied, regarding the accuracy, completeness, or suitability of any content or products presented. Nothing on this website should be construed as legal, tax, investment, financial, medical, or other professional advice. In addition, no part of this site—including articles or product references—constitutes a solicitation, recommendation, endorsement, advertisement, or offer to buy or sell any securities, franchises, or other financial instruments, particularly in jurisdictions where such activity would be unlawful.
All content is of a general nature and may not address the specific circumstances of any individual or entity. It is not a substitute for professional advice or services. Any actions you take based on the information provided here are strictly at your own risk. You accept full responsibility for any decisions or outcomes arising from your use of this website and agree to release us from any liability in connection with your use of, or reliance upon, the content or products found herein.