
|
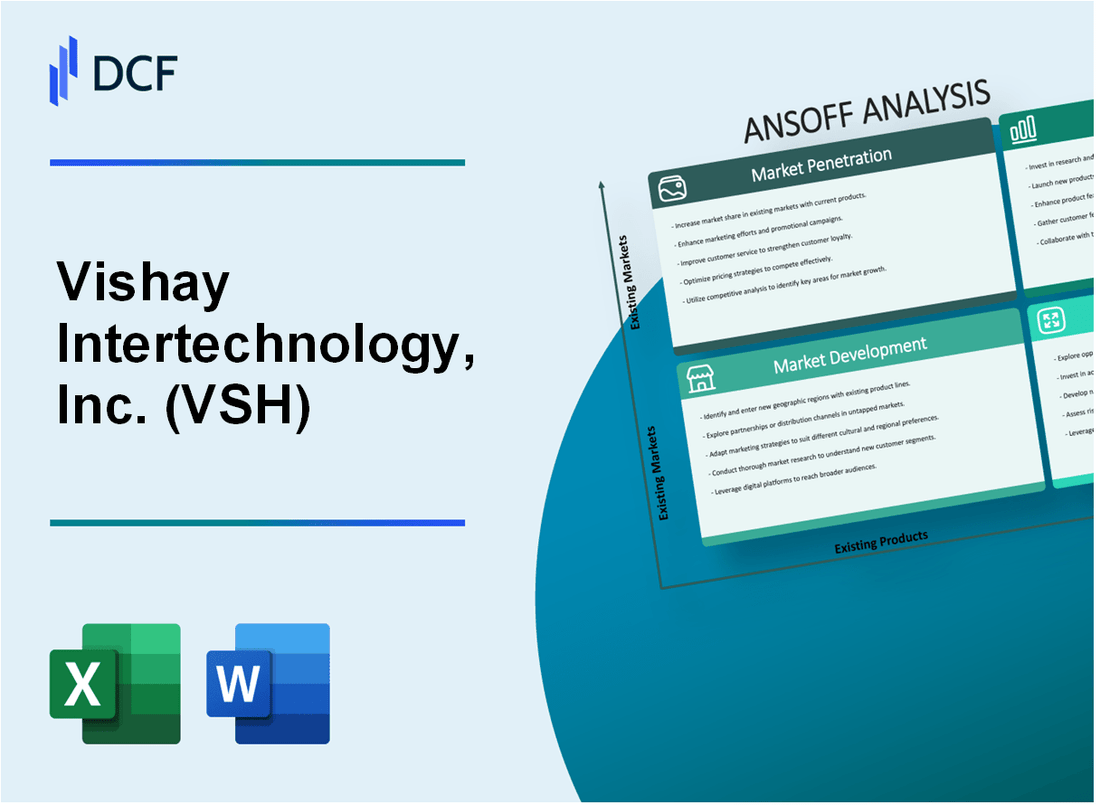
Vishay Intertechnology, Inc. (VSH): ANSOFF MATRIX [Dec-2025 Updated] |
Fully Editable: Tailor To Your Needs In Excel Or Sheets
Professional Design: Trusted, Industry-Standard Templates
Investor-Approved Valuation Models
MAC/PC Compatible, Fully Unlocked
No Expertise Is Needed; Easy To Follow
Vishay Intertechnology, Inc. (VSH) Bundle
You're looking at Vishay Intertechnology, Inc. (VSH) right now, and honestly, navigating the cyclical components market demands clear, actionable strategy, not just vague potential. As a leader in discrete semiconductors and passive components, their growth playbook is laid out across the Ansoff Matrix, showing concrete paths: from defending that $1.5 billion core revenue base with targeted market penetration, to chasing high-growth areas like EV components in new markets, and even making big bets like a $150 million capital expenditure push for advanced packaging or a software acquisition for diversification. I've distilled the near-term risks and the precise actions I'd be tracking for the next few quarters-dive in below to see the full breakdown.
Vishay Intertechnology, Inc. (VSH) - Ansoff Matrix: Market Penetration
You're looking at how Vishay Intertechnology, Inc. can drive more sales from its current customer base and markets, which is the essence of market penetration. The recent third quarter of fiscal year 2025 revenue hit $790.6 million, and the trailing twelve months revenue stood at $2.98 Billion USD.
To push higher-margin items in the existing industrial market, the action involves increasing sales team incentives targeting products like power MOSFETs. For context on that specific product line, the gross margin for MOSFETs in the second quarter of 2025 was 6.3%, down from 13.9% a year prior.
To capture more wallet share from existing top-tier automotive customers, the plan is to offer volume discounts aimed at securing an additional 5% of their current component spend. Automotive remains a key focus, showing sequential revenue growth in the prior year, driven by EV and hybrid demand.
A targeted digital campaign focuses on converting competitor customers in the computing sector by highlighting Vishay Intertechnology's superior lead times. The overall book-to-bill ratio for the third quarter of 2025 was 0.97, though the semiconductor portion was 0.96, while the second quarter showed an overall book-to-bill of 1.02.
To defend the $1.5 billion core revenue base derived from standard resistors and capacitors, a global price-matching program is being implemented. The passive components group, which includes capacitors, showed a book-to-bill ratio of 1.06 in the second quarter of 2025, with capacitors themselves hitting 1.40 in that same period.
Expanding distribution channel partnerships across North America and Europe is key to improving shelf-space and regional availability. For the second quarter of 2025, the revenue mix showed Asia as a significant driver, contributing 42% of total revenue, while the Americas declined 2% year-over-year and Europe fell 3% year-over-year.
Here are some key financial metrics relevant to the current operational base:
| Metric | Q3 2025 Value | Q2 2025 Value | Guidance/Context |
| Revenue | $790.6 million | $762.3 million | Q4 2025 Guidance Midpoint: $790 million |
| Gross Margin | 19.5% | 19.5% | Q1 2025 Margin: 19.0% |
| Overall Book-to-Bill | 0.97 | 1.02 | Passive Components Q2 B/B: 1.06 |
| SG&A Guidance (FY 2025) | N/A | N/A | $540 million to $560 million (excluding Q2 benefit) |
The focus on existing markets involves several operational levers:
- Push high-margin products like power MOSFETs in the existing industrial market.
- Offer volume discounts to top-tier automotive customers to capture an additional 5% of their current component spend.
- Launch a targeted digital campaign to convert competitor's customers in the computing sector, focusing on Vishay Intertechnology's superior lead times.
- Implement a global price-matching program for standard resistors and capacitors to defend the $1.5 billion core revenue base.
- Expand distribution channel partnerships in North America and Europe to improve shelf-space and regional availability.
Finance: finalize the Q4 2025 revenue projection variance analysis by next Tuesday.
Vishay Intertechnology, Inc. (VSH) - Ansoff Matrix: Market Development
You're looking at where Vishay Intertechnology, Inc. can deploy its existing component portfolio into new geographic or application spaces. This is Market Development, and for Vishay Intertechnology, Inc., the focus is clearly on capitalizing on global electrification and digitalization trends outside its current core strongholds.
Target emerging electric vehicle (EV) manufacturing hubs in Southeast Asia, specifically for high-voltage capacitors and power inductors.
The ASEAN Electric Vehicle Market size is valued at USD 4.55 billion in 2025, projected to reach USD 18.66 billion by 2030 with a 32.61% CAGR. Vishay Intertechnology, Inc.'s Q3 2025 net revenues from Asia were $340.3 million. The global Automotive High Voltage Electric Capacitor Market is estimated at USD 663.3 million in 2025. Vishay Intertechnology, Inc. introduced a new series of high-voltage combined aluminum capacitors in December 2025.
Establish a dedicated sales and technical support office in India to capture the rapidly growing domestic industrial automation market.
The India Industrial Automation Market size stands at USD 17.28 billion in 2025 and is projected to reach USD 33.64 billion by 2030, registering a 14.26% CAGR. The automotive segment holds the largest share of this market vertical. This push supports existing Vishay Intertechnology, Inc. product lines, as Inductors saw a 3.9% decrease in net revenues quarter-over-quarter, partially due to automotive end-market customers in Q3 2025.
Qualify Vishay's existing portfolio of optoelectronics for new, non-traditional markets like agricultural technology (AgriTech) sensors.
Vishay Intertechnology, Inc. is a world leader in infrared components, including optical sensors. While specific revenue attribution for AgriTech is not public, the company's overall Q3 2025 revenue was $790.6 million. The Optoelectronic Components Segment reported a 2.7% increase in net revenues over the previous quarter in Q3 2025.
Partner with major Chinese telecom equipment manufacturers to supply existing diode and rectifier products for 5G infrastructure build-out.
China is estimated to invest over $215 billion in 5G network infrastructure by 2025. The global 5G Infrastructure Market size is valued at USD 16 billion in 2025, with the China 5G infrastructure market expected to grow at a 26.1% CAGR from 2024 to 2030. Vishay Intertechnology, Inc.'s Q3 2025 revenue growth demonstrated alignment with smart grid infrastructure, a related sector.
Adapt product packaging and documentation to meet specific regulatory standards in South American countries to open new distribution channels.
Market entry requires understanding diverse, country-specific safety standards and certification procedures across Latin America.
- Argentina requires IRAM S Mark and EN ACOM certification.
- Brazil mandates INMETRO and ANATEL certification.
- Colombia enforces RETIE/RETILAP/RETIQ and CRC certification.
- Mexico's NOM and IFETEL requirements are shifting, with IFETEL functions transferring to a new Digital Transformation and Telecommunications Agency in 2025.
The Americas reported net revenues of $191.6 million in Q3 2025.
| Market Development Initiative | Target Market Metric (2025) | Vishay Intertechnology, Inc. Context/Data Point |
|---|---|---|
| Southeast Asia EV Hubs | ASEAN EV Market: USD 4.55 billion | Asia Regional Revenue (Q3 2025): $340.3 million |
| India Industrial Automation | India Automation Market: USD 17.28 billion | Capacitors Segment Revenue increased 7.8% QoQ in Q3 2025, driven by Asia/Europe |
| AgriTech Sensors (Optoelectronics) | No specific market size found | Optoelectronics Segment Revenue increased 2.7% QoQ in Q3 2025 |
| China 5G Infrastructure | China 5G Investment (by 2025): over $215 billion | Q3 2025 Revenue growth aligned with smart grid infrastructure |
| South American Distribution | Brazil Revenue Growth Forecast: 0.83% annually | The Americas Regional Revenue (Q3 2025): $191.6 million |
Vishay Intertechnology, Inc. (VSH) - Ansoff Matrix: Product Development
You're looking at how Vishay Intertechnology, Inc. (VSH) is pushing new products into the market, which is the core of the Product Development quadrant in the Ansoff Matrix. This isn't just about tweaking old parts; it's about making big bets on future tech like silicon carbide (SiC) and advanced packaging.
Take SiC, for example. Vishay Intertechnology, Inc. is definitely doubling down here, especially with the electric vehicle and AI power needs growing. They just announced two new 1200 V SiC MOSFET power modules on December 3, 2025. This follows their earlier 1200V SiC MOSFET line from June 2024, showing a consistent push. The big factory build-out at the Newport wafer fab is on schedule for SiC pre-production in early 2026. That's the real-life timeline you need to watch.
To support these high-growth product lines, Vishay Intertechnology, Inc. has a significant capital plan. For the full year 2025, management plans to spend between $300 million to $350 million in capital expenditures. Honestly, at least 70% of that cash is earmarked specifically for capital expansion projects aimed at these growth areas. Over the last two and a half years, this heavy investment strategy, part of Vishay 3.0, has already seen about $775 million invested to add capacity for higher-profit products. The company's Invested Capital stood at $3.0Bn quarterly as of June 2025.
Developing integrated modules is key for simplifying the Bill of Materials (BOM) for automotive Tier 1 suppliers, which is a smart way to lock in design wins. While I don't have the exact dollar amount tied to a new sensor line for oil and gas drilling, the overall strategy is clear: use existing tech, like thin-film resistors, to shrink components for wearables, and build complex modules to simplify customer assembly. It's about making the component do more work.
Here's a quick look at the recent operational performance from the third quarter of 2025, which shows the environment these product investments are happening in:
| Metric | Value (Q3 2025) |
| Revenue | $790.6 million |
| Adjusted EPS | $0.04 |
| Gross Margin | 19.5% |
| Book-to-Bill Ratio | 0.97 |
| Backlog (Months) | 4.4 months |
The focus on capacity readiness means Vishay Intertechnology, Inc. is positioning itself to capture the market upturn, which is already showing signs of life, with the July book-to-bill for semis bouncing to 1.07. This readiness is crucial for new product ramps.
The tangible goals tied to these product and capacity investments include specific capacity increases planned for 2026:
- Increase annualized capacity for MOSFETs by 12% in the first quarter of 2026.
- Increase annualized capacity for advanced split-gate MOSFETs by 25% in 2026.
- Continue advancing the automotive qualification process and volume ramp-up for commercial diodes in Taiwan.
For the immediate future, management guided Q4 2025 revenues to be in the range of $790 million +/- $20 million, with the gross profit margin expected around 19.5%, still facing a negative impact of approximately 150 to 175 basis points related to the Newport operations.
Finance: draft 13-week cash view by Friday.
Vishay Intertechnology, Inc. (VSH) - Ansoff Matrix: Diversification
You're looking at how Vishay Intertechnology, Inc. can move beyond its core business of discrete semiconductors and passive components. Diversification, in this context, means entering entirely new markets or offering entirely new types of solutions. It's a big step, especially when the company is already executing a major capital plan, projecting capital expenditures between $300 million to $350 million for fiscal year 2025, with at least 70% dedicated to capacity expansion for existing high-growth product lines like AI power and automotive.
Consider acquiring a small, specialized software company focused on power management algorithms to offer a combined hardware-software solution package. This moves Vishay Intertechnology, Inc. up the value chain from just selling parts to selling integrated solutions. Right now, the gross margin for Vishay Intertechnology, Inc. sits at 19.5% as of Q3 2025. A software component could carry a significantly higher margin, helping to offset the pressure from commodity costs, like the metals impact that dragged margins down by approximately 150 basis points in Q3 2025.
Entering the energy storage market by developing and manufacturing large-format Battery Management System (BMS) components for grid-scale applications aligns well with existing market alignment. Vishay Intertechnology, Inc. already sees revenue growth from smart grid infrastructure. Furthermore, the company is actively developing high-voltage components for electric vehicles, having commercialized 1700V planar MOSFETs in Q2 2025 and 650V planar MOSFETs in Q3 2025, and recently releasing new 1200 V SiC MOSFET power modules. This is a natural adjacency, leveraging existing material science expertise.
Establishing a new business unit focused on providing component-level recycling and refurbishment services to large industrial clients creates a circular economy revenue stream. This is a service play, not a product play. It offers a recurring revenue possibility, which is valuable when the current book-to-bill is slightly below one at 0.97, indicating orders are not quite keeping pace with shipments. This service could also enhance customer stickiness, supporting the overall strategy of deepening customer relationships.
Partnering with a university research lab to co-develop quantum computing components represents a completely new, high-risk, high-reward market. This is the furthest from the current core. It contrasts sharply with the near-term focus on expanding capacity for proven technologies. The current backlog stands at 4.4 months, suggesting near-term demand visibility is moderate. Any quantum effort would be a long-term R&D hedge, separate from the current operational spend.
Launching a subscription-based technical consulting service leverages Vishay Intertechnology, Inc.'s deep component expertise to advise new electronics startups on design optimization. This is a low-capital way to generate high-margin revenue. The company is already streamlining SG&A functions, expecting annualized savings of approximately $12 million starting in Q1 2025 from restructuring. A consulting service could tap into that expertise directly, perhaps offering a premium service tier to existing design-win customers.
Here are some key figures from the latest reported period for context:
| Metric | Amount/Value (Q3 2025) | Context |
| Net Revenues | $790.6 million | Q3 2025 Reported Revenue |
| Year-over-Year Revenue Growth | 8% | Q3 2025 vs. Q3 2024 |
| Adjusted EPS | $0.04 | Q3 2025 Adjusted Earnings Per Share |
| Gross Margin | 19.5% | Q3 2025 Gross Margin |
| Backlog Duration | 4.4 months | At Quarter End September 27, 2025 |
| FY 2025 Capex Guidance | $300 million to $350 million | Planned Capital Expenditures |
For any of these diversification moves, you need to consider the existing strategic direction and resource allocation. The company is focused on internal capacity expansion, which is consuming a significant portion of capital. The key areas Vishay Intertechnology, Inc. is currently aligning with for growth include:
- AI related power requirements
- Automotive and aerospace/defense sectors
- Smart grid infrastructure projects
- Expanding SiC MOSFET and diode capabilities
The recent dividend declaration of $0.10 per share payable on December 12, 2025, shows a commitment to shareholder returns, which any new, capital-intensive diversification must not jeopardize. Finance: draft 13-week cash view by Friday.
Disclaimer
All information, articles, and product details provided on this website are for general informational and educational purposes only. We do not claim any ownership over, nor do we intend to infringe upon, any trademarks, copyrights, logos, brand names, or other intellectual property mentioned or depicted on this site. Such intellectual property remains the property of its respective owners, and any references here are made solely for identification or informational purposes, without implying any affiliation, endorsement, or partnership.
We make no representations or warranties, express or implied, regarding the accuracy, completeness, or suitability of any content or products presented. Nothing on this website should be construed as legal, tax, investment, financial, medical, or other professional advice. In addition, no part of this site—including articles or product references—constitutes a solicitation, recommendation, endorsement, advertisement, or offer to buy or sell any securities, franchises, or other financial instruments, particularly in jurisdictions where such activity would be unlawful.
All content is of a general nature and may not address the specific circumstances of any individual or entity. It is not a substitute for professional advice or services. Any actions you take based on the information provided here are strictly at your own risk. You accept full responsibility for any decisions or outcomes arising from your use of this website and agree to release us from any liability in connection with your use of, or reliance upon, the content or products found herein.