
|
Washington Federal, Inc. (WAFD): 5 FORCES Analysis [Apr-2026 Updated] |
Fully Editable: Tailor To Your Needs In Excel Or Sheets
Professional Design: Trusted, Industry-Standard Templates
Investor-Approved Valuation Models
MAC/PC Compatible, Fully Unlocked
No Expertise Is Needed; Easy To Follow
Washington Federal, Inc. (WAFD) Bundle
You're looking for a clear, actionable view of Washington Federal, Inc.'s (WAFD) competitive position now that they've heavily shifted to commercial banking, and honestly, the forces at play are intense. While the bank has built a solid funding base-core deposits hit 77.9% of total deposits as of September 30, 2025, and commercial loans made up 83% of FY 2025 originations-the pressure is mounting from every angle, from digital substitutes to fierce rivalry in the Northwest. This Five Forces analysis cuts right to the chase, showing you precisely where their strong deposit structure helps them manage supplier power versus where high customer switching costs are still low, so stick around to see the full map of risks and opportunities.
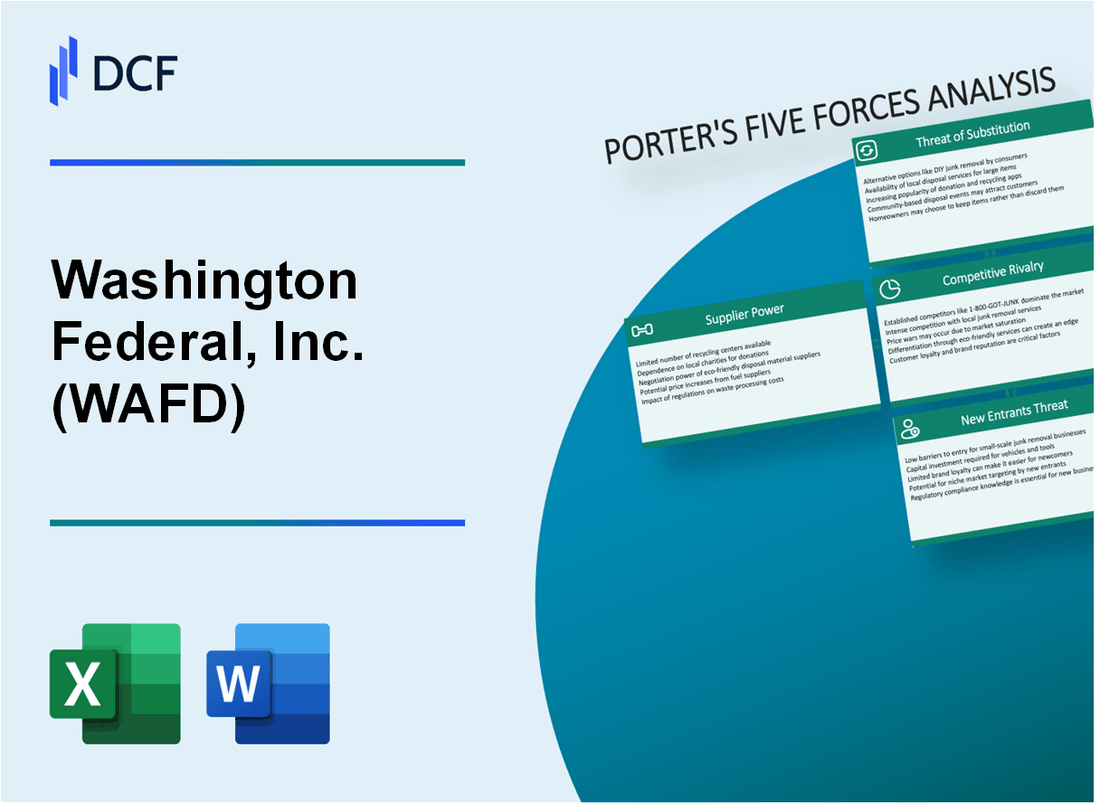
Washington Federal, Inc. (WAFD) - Porter's Five Forces: Bargaining power of suppliers
When looking at Washington Federal, Inc. (WAFD)'s suppliers, you're primarily looking at those providing the bank with its core funding: depositors and, secondarily, wholesale funding sources and technology providers. The power these groups hold directly impacts Washington Federal, Inc.'s net interest margin (NIM).
The cost of deposits is a major lever for suppliers. While high interest rates generally increase the cost of funding loans, Washington Federal, Inc. has been actively managing this pressure through strategic deposit gathering. Management noted that the net interest margin improved in the fourth quarter of Fiscal Year 2025, driven by a decreasing cost of deposits and borrowings. This suggests that, as of late 2025, Washington Federal, Inc. has successfully mitigated some of the upward pressure from the rate environment on its deposit costs.
The quality and stickiness of the deposit base are crucial defenses against supplier power. A stable, low-cost deposit base means Washington Federal, Inc. doesn't need to aggressively compete on rates for every dollar. As of September 30, 2025, the bank's core deposits-defined as transaction accounts and time deposits under $250,000-were strong at 77.9% of total deposits. This high percentage indicates a relatively sticky funding base, which limits the power of individual depositors to demand higher rates for fear of immediate deposit flight. Furthermore, deposits that are uninsured or not collateralized were a manageable 24.7% of total deposits as of September 30, 2025, which is a key metric for stability.
Reliance on more volatile, wholesale funding sources, like borrowings, gives those suppliers more leverage. Washington Federal, Inc. has clearly worked to reduce this reliance. Borrowings totaled $1.8 billion as of September 30, 2025, a significant decrease from $3.3 billion at September 30, 2024. This reduction in wholesale funding lowers the bargaining power of those alternative, often more rate-sensitive, funding suppliers.
Here's a quick look at the funding mix as of the end of Fiscal Year 2025:
| Funding Component | Amount/Percentage (as of Sept 30, 2025) |
| Core Deposits (% of Total Deposits) | 77.9% |
| Uninsured Deposits (% of Total Deposits) | 24.7% |
| Total Borrowings | $1.8 billion |
Technology vendors, the suppliers of core banking systems and specialized platforms, present a different dynamic. For Washington Federal, Inc., which has invested heavily in its digital capabilities, these vendors hold moderate power. This is because core banking systems are highly specialized; switching providers is costly, time-consuming, and disruptive to operations. However, the power is tempered by the fact that Washington Federal, Inc. is actively managing its technology stack, integrating various modern services.
The overall supplier landscape for Washington Federal, Inc. shows a strategic shift toward lower-cost, more stable funding, which inherently reduces supplier bargaining power:
- Strong core deposit base limits depositor leverage.
- Reduced borrowings lessen reliance on wholesale markets.
- Management is actively working to improve deposit mix.
- Technology vendors maintain moderate power due to system specialization.
Finance: review the Q1 2026 deposit beta projections against the current core deposit percentage by next Tuesday.
Washington Federal, Inc. (WAFD) - Porter's Five Forces: Bargaining power of customers
You're analyzing Washington Federal, Inc.'s position, and the customer power dynamic is split. For the traditional lending side, especially for retail mortgages and smaller loans, the bargaining power of customers is high. Lending is, at its core, a commoditized service; customers can easily shop rates across dozens of platforms. If you're a retail borrower, you're definitely looking at the Annual Percentage Rate (APR) and the closing costs, making it easy to switch banks for a better deal.
Washington Federal, Inc. is actively trying to tilt this balance in its favor by focusing heavily on the commercial side. The management team launched the 'Build 2030' initiative to accelerate the shift from a thrift model to a commercial bank, which includes expanding treasury solutions. The idea here is simple: for a business client, switching banks means moving not just a loan, but also operating accounts, treasury management services, and payroll systems. That integration creates friction, which translates directly into higher switching costs for commercial clients, thus lowering their bargaining power relative to a simple mortgage customer.
The numbers from Fiscal Year 2025 clearly show where Washington Federal, Inc.'s focus-and its defense against customer power-lies. The business mix is heavily weighted toward commercial relationships:
| Loan Origination Category | Percentage of Total Loan Originations (FY 2025) | Comparison Point (FY 2024) |
|---|---|---|
| Commercial Loans | 83% | 73% |
| Consumer Loans | 17% | 27% (Implied) |
This 83% concentration in commercial loans for Fiscal Year 2025, up from 73% in Fiscal Year 2024, shows management is successfully driving volume where switching costs are inherently higher. Still, the retail segment remains a factor. Retail customers have low switching costs and can quickly compare rates across platforms, meaning Washington Federal, Inc. must maintain competitive pricing and excellent service to retain them.
To be fair, high customer satisfaction can slightly mitigate the power of the retail customer base. The J.D. Power 2025 U.S. Retail Banking Satisfaction Study showed that overall customer satisfaction with primary retail banking partners rose to 655 on a 1,000-point scale, an 11-point increase over the previous year. While Banner Bank was noted as the highest-ranked in the Northwest region in that study, Washington Federal, Inc.'s ability to deliver on service-especially in problem resolution, where 85% of customers who experienced an issue had it resolved-helps keep its retail customers from defecting purely on service grounds.
Here are a few other data points that frame the customer landscape for Washington Federal, Inc. as of mid-2025:
- Total Assets stood at $26.7B as of June 30, 2025.
- Checking accounts grew from 33% to 35% of total deposits over the year.
- Mortgage and Consumer loans made up 41% of total net loans as of June 30, 2025.
- Total Deposits were $21.4B at June 30, 2025.
- Loan originations totaled $4.0B for the full fiscal year 2025.
The bank's success in shifting its loan mix toward commercial lending is its primary lever to reduce the overall bargaining power of its customer base. Finance: review the Q1 2026 pipeline to see if commercial loan origination percentage remains above 80% by end of next quarter.
Washington Federal, Inc. (WAFD) - Porter's Five Forces: Competitive rivalry
You're looking at the competitive landscape in the Northwest, and honestly, it's a crowded space. Washington Federal, Inc. (WAFD) faces high rivalry from established giants like Chase and regional players such as Banner Bank. This intense competition for market share in the region forces Washington Federal, Inc. (WAFD) to be sharp on pricing and service delivery.
The overall environment, characterized by high rates through much of 2025, has slowed overall loan growth, which naturally intensifies the competition for any quality asset that comes to market. When growth is constrained, every new loan or deposit becomes a harder-fought battle. To counter the commoditization often seen in its former primary focus, Washington Federal, Inc. (WAFD) has made a clear strategic pivot.
The shift away from single-family mortgage lending is a direct response to this rivalry, targeting the less commoditized business banking segment. This move is supported by tangible results in loan activity; for instance, new loan originations saw a 103% increase over the third quarter of fiscal 2025, signaling momentum in the new focus areas. Total annual loan originations for fiscal year 2025 reached $4.0 billion, up from $3.6 billion in fiscal year 2024.
Managing costs is crucial when margins are under pressure from competitors. Washington Federal, Inc. (WAFD)'s efficiency ratio for the fourth quarter of fiscal 2025 stood at 56.82%. While this is competitive, it demands defintely continued cost management, especially when you see that peers operate with an efficiency ratio closer to 55%.
Here's a quick look at how Washington Federal, Inc. (WAFD)'s profitability metrics stacked up against reported peer averages in Q4 2025:
| Metric | Washington Federal, Inc. (WAFD) Q4 2025 | Peers Q4 2025 Estimate |
|---|---|---|
| Efficiency Ratio | 56.82% | 55% |
| Net Interest Margin (NIM) | 2.71% | 3.42% |
| Return on Assets (ROA) | 0.91% | 1.22% |
| Return on Tangible Common Equity (ROTCE) | 9.99% | 13% |
To gain an edge in the business banking space, Washington Federal, Inc. (WAFD) is actively competing by securing key designations. The bank was designated as a Preferred Lender with the U.S. Small Business Administration (SBA) in September 2025. This status is reserved for lenders with a proven track record in SBA lending and it directly addresses the need for speed in a competitive market.
This SBA Preferred Lender status grants Washington Federal, Inc. (WAFD) increased authority to approve, close, and service SBA-guaranteed loans, which means faster turn times for small business customers. This is a concrete action to win business against rivals. The bank is also focused on improving its deposit mix, with non-interest-bearing deposits ending Q4 2025 at 12% of total deposits, a key area for margin improvement.
The competitive advantages gained through this strategic shift include:
- Faster approvals for SBA-backed loans.
- Streamlined application process for clients.
- Expanded access to 7(a) and 504 loan programs.
- Demonstrated commitment to small business growth.
The bank's market capitalization stood at $2.4 billion as of September 2025, and it maintains a P/E ratio of 11.7 based on InvestingPro data from that time. Furthermore, Washington Federal, Inc. (WAFD) has a long-standing commitment to shareholder returns, maintaining dividend payments for 43 consecutive years.
Washington Federal, Inc. (WAFD) - Porter's Five Forces: Threat of substitutes
The threat of substitutes for Washington Federal, Inc. remains substantial, driven by the migration of both commercial credit and retail funding to non-bank and digital-native alternatives. You see this pressure in the market data, which shows non-traditional players capturing significant share.
Nonbank financial institutions and private credit funds are growing rapidly, substituting traditional commercial loans. PitchBook data projects private credit's market share in middle market lending to hit 40% by 2025. This segment, which reached $1.7 trillion in the U.S. by early 2024, continues to offer flexibility that banks struggle to match, with non-bank lenders financing 85% of U.S. leveraged buyouts in 2024. Furthermore, non-bank sources comprised nearly 23% of total credit extended to non-financial corporations in 2024.
FinTech firms and neobanks offer superior digital experiences for retail deposits and payments. The global neobanking market is projected to reach $230.55 billion in 2025. In North America specifically, neobanking revenue is forecast to grow from $5.93B in 2021 to $30.12B in 2025. This digital shift is reflected in user adoption, with U.S. neobank account holders expected to reach 53.7 million in 2025. The preference for digital experience is clear, as 68% of digital banking users report that neobank apps offer superior budgeting and financial management tools compared to traditional banks.
Increased use of money market funds and government bonds substitutes for bank deposits in high-rate environments. Money market fund assets in the U.S. increased by $45.51 billion to reach $7.57 trillion for the six-day period ended November 25, 2025. This dynamic reflects a substitution where MMFs, due to faster interest rate passthrough, attracted cumulative inflows while bank deposits declined over the 2022-2024 period. As of late October 2025, Treasury bills returned approximately 4% year-to-date, underperforming other major asset classes.
Washington Federal, Inc.'s non-interest income grew from its insurance subsidiary, diversifying revenue away from core banking. This diversification is a direct countermeasure to revenue concentration risk. Here are the figures for WaFd Insurance:
| Period | WaFd Insurance Revenue (Millions USD) | Year-over-Year Growth |
|---|---|---|
| Q4 Fiscal 2025 | $4.6 | N/A |
| Fiscal Year 2025 | $19.5 | 12.5% |
The contribution from the insurance segment was noted as a positive factor in the second fiscal quarter of 2025, which saw a 20% increase in total non-interest income compared to the first quarter of 2025. However, this revenue stream is variable, as commission income from the subsidiary slightly decreased in Q1 2025 compared to the prior quarter, and decreased in Q3 2025 due to the timing of annual contingency fee income.
The competitive landscape for deposits is also shifting internally, as Washington Federal, Inc. focuses on its core business mix:
- Checking accounts grew from 33% of total deposits to 35% over Fiscal Year 2025.
- Deposits increased by $51 million in Q4 2025, even as loans receivable decreased by $188 million.
- The company exited single-family mortgage lending as part of its strategic shift toward business banking solutions.
- Total non-interest income for Q4 2025 was $18.4 million.
- Total non-interest income for Fiscal Year 2025 was approximately $72.1 million (sum of Q1 $15.7M, Q2 $18.9M, Q3 $18.3M, Q4 $18.4M, adjusting for minor discrepancies in source data).
Washington Federal, Inc. (WAFD) - Porter's Five Forces: Threat of new entrants
The threat of new entrants for Washington Federal, Inc. remains relatively low, primarily due to the substantial regulatory and capital barriers inherent in the banking sector. You see this barrier not just in the abstract, but in the very real compliance challenges Washington Federal, Inc. itself is navigating.
Regulatory hurdles are high; WAFD itself received a 'Needs to Improve' CRA (Community Reinvestment Act) compliance rating from the FDIC on December 27, 2024. This rating, stemming from a subpar performance on the Lending Test, could restrict the bank's ability to pursue mergers, acquisitions, or branch expansions until the next evaluation, which is anticipated in 2026. Furthermore, the bank recently saw two consent orders related to its Home Mortgage Disclosure Act program end, which is a positive regulatory update, but the overall environment is clearly stringent.
Significant capital requirements and the need for deposit insurance create major barriers for any startup. To be considered well-capitalized, Washington Federal Bank needed a Common Equity Tier I (CET1) ratio of at least 6.5% as of June 30, 2025. Washington Federal, Inc. reported a CET1 ratio of 11.7% at that same date, showing a comfortable buffer above the threshold. For context, the Federal Reserve sets a minimum CET1 capital ratio requirement of 4.5% for large banks, plus a Stress Capital Buffer (SCB) of at least 2.5%. A new entrant would need to raise and maintain these levels before even beginning operations, which requires massive upfront funding.
New digital-only banks, or neobanks, present a different kind of entry vector. They can enter with significantly lower operating costs, reportedly up to 40% lower compared to traditional banks, by avoiding the overhead of physical infrastructure. However, they lack the established physical presence that Washington Federal, Inc. maintains. As of June 30, 2025, Washington Federal Bank operated 208 branches across nine western states. A new digital entrant would need to build trust and a customer base from scratch without the immediate geographic reach or the option for in-person service that 208 locations provide.
Washington Federal, Inc.'s own strategic investments increase the required scale for a new regional entrant to compete effectively. The bank reported that its total non-interest expense for the fourth fiscal quarter of 2025 was $107.0 million, reflecting an increase of $2.7 million, or 2.6%, from the prior quarter, driven by strategic investments in people and technologies. To match the scale and technological sophistication of an established player like Washington Federal, Inc.-which reported total assets of $27.6 billion as of March 31, 2025-a new regional entrant must commit similar, substantial, ongoing capital to technology and talent from day one.
| Metric | Washington Federal, Inc. (WAFD) Data Point | Date/Period |
| Branch Network Size | 208 | June 30, 2025 |
| CET1 Ratio (Actual) | 11.7% | June 30, 2025 |
| CET1 Ratio (Well Capitalized Threshold) | 6.5% | Regulatory Standard |
| Large Bank Minimum CET1 Requirement | 4.5% (plus SCB of at least 2.5%) | 2025 Regulatory Standard |
| Neobank Operational Cost Advantage | Up to 40% lower | Comparison to Traditional Banks |
| Q4 FY2025 Tech Investment Impact (Expense Increase) | $2.7 million (or 2.6%) | Q4 FY2025 |
| Total Assets | $27.6 billion | March 31, 2025 |
- CRA Rating: 'Needs to Improve'.
- Next CRA Evaluation: Anticipated in 2026.
- Fiscal Year 2025 Net Income: $226 million.
- Restructuring Charge for Business Model Shift: $5.4 million (Q1 FY2025).
Disclaimer
All information, articles, and product details provided on this website are for general informational and educational purposes only. We do not claim any ownership over, nor do we intend to infringe upon, any trademarks, copyrights, logos, brand names, or other intellectual property mentioned or depicted on this site. Such intellectual property remains the property of its respective owners, and any references here are made solely for identification or informational purposes, without implying any affiliation, endorsement, or partnership.
We make no representations or warranties, express or implied, regarding the accuracy, completeness, or suitability of any content or products presented. Nothing on this website should be construed as legal, tax, investment, financial, medical, or other professional advice. In addition, no part of this site—including articles or product references—constitutes a solicitation, recommendation, endorsement, advertisement, or offer to buy or sell any securities, franchises, or other financial instruments, particularly in jurisdictions where such activity would be unlawful.
All content is of a general nature and may not address the specific circumstances of any individual or entity. It is not a substitute for professional advice or services. Any actions you take based on the information provided here are strictly at your own risk. You accept full responsibility for any decisions or outcomes arising from your use of this website and agree to release us from any liability in connection with your use of, or reliance upon, the content or products found herein.