
|
Weibo Corporation (WB) DCF Valuation |
Fully Editable: Tailor To Your Needs In Excel Or Sheets
Professional Design: Trusted, Industry-Standard Templates
Investor-Approved Valuation Models
MAC/PC Compatible, Fully Unlocked
No Expertise Is Needed; Easy To Follow
Weibo Corporation (WB) Bundle
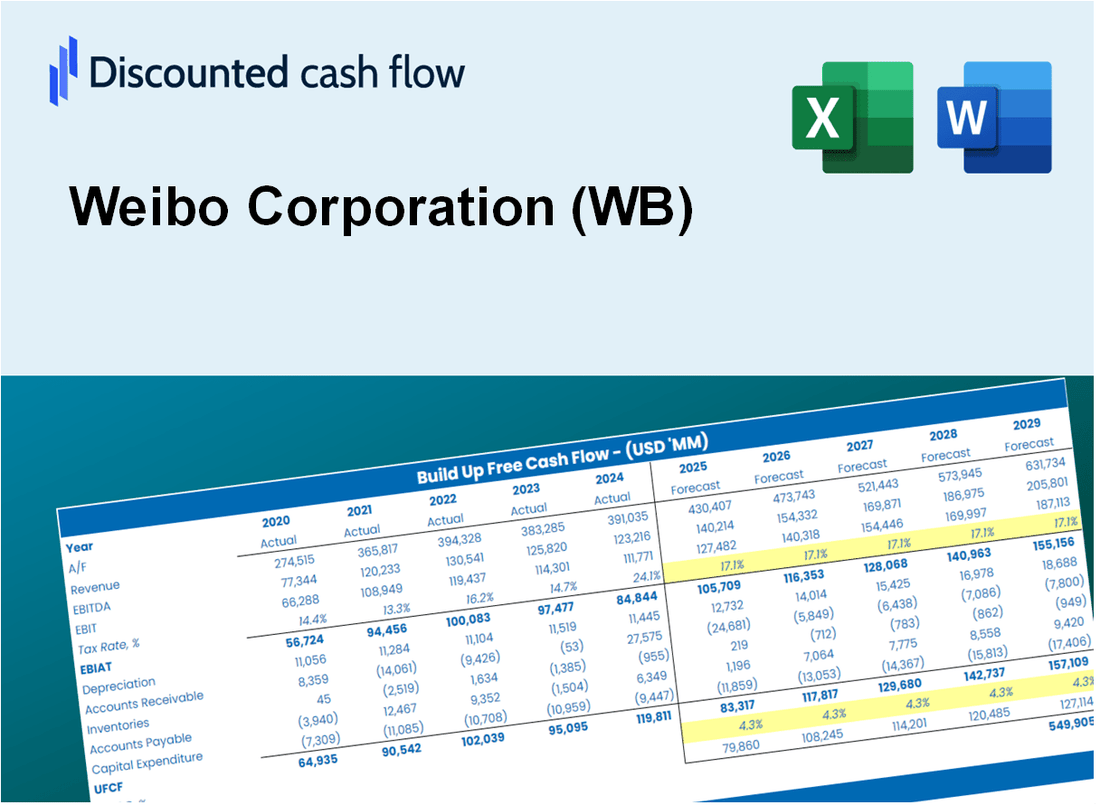
Engineered for accuracy, our (WB) DCF Calculator enables you to evaluate Weibo Corporation's valuation using real-world financial data, offering complete flexibility to modify all essential parameters for enhanced projections.
Discounted Cash Flow (DCF) - (USD MM)
| Year | AY1 2020 |
AY2 2021 |
AY3 2022 |
AY4 2023 |
AY5 2024 |
FY1 2025 |
FY2 2026 |
FY3 2027 |
FY4 2028 |
FY5 2029 |
|---|---|---|---|---|---|---|---|---|---|---|
| Revenue | 1,689.9 | 2,257.1 | 1,836.3 | 1,759.8 | 1,754.7 | 1,800.6 | 1,847.7 | 1,896.0 | 1,945.6 | 1,996.4 |
| Revenue Growth, % | 0 | 33.56 | -18.64 | -4.17 | -0.29315 | 2.62 | 2.62 | 2.62 | 2.62 | 2.62 |
| EBITDA | 459.0 | 668.7 | 265.8 | 714.5 | 619.0 | 529.9 | 543.7 | 558.0 | 572.5 | 587.5 |
| EBITDA, % | 27.16 | 29.63 | 14.48 | 40.6 | 35.28 | 29.43 | 29.43 | 29.43 | 29.43 | 29.43 |
| Depreciation | 36.1 | 61.2 | 66.2 | 91.6 | 93.0 | 68.3 | 70.0 | 71.9 | 73.8 | 75.7 |
| Depreciation, % | 2.14 | 2.71 | 3.6 | 5.21 | 5.3 | 3.79 | 3.79 | 3.79 | 3.79 | 3.79 |
| EBIT | 422.9 | 607.5 | 199.7 | 622.9 | 526.1 | 461.6 | 473.7 | 486.1 | 498.8 | 511.8 |
| EBIT, % | 25.03 | 26.92 | 10.87 | 35.39 | 29.98 | 25.64 | 25.64 | 25.64 | 25.64 | 25.64 |
| Total Cash | 3,496.9 | 3,134.8 | 3,171.2 | 3,225.7 | 2,350.5 | 1,800.6 | 1,847.7 | 1,896.0 | 1,945.6 | 1,996.4 |
| Total Cash, percent | .0 | .0 | .0 | .0 | .0 | .0 | .0 | .0 | .0 | .0 |
| Account Receivables | 1,241.9 | 1,577.1 | 1,253.5 | 1,169.1 | 1,017.6 | 1,210.1 | 1,241.8 | 1,274.3 | 1,307.6 | 1,341.8 |
| Account Receivables, % | 73.49 | 69.87 | 68.26 | 66.43 | 57.99 | 67.21 | 67.21 | 67.21 | 67.21 | 67.21 |
| Inventories | .0 | .0 | .0 | 14.2 | .0 | 2.9 | 3.0 | 3.1 | 3.1 | 3.2 |
| Inventories, % | 0 | 0 | 0 | 0.80633 | 0 | 0.16127 | 0.16127 | 0.16127 | 0.16127 | 0.16127 |
| Accounts Payable | 149.5 | 197.6 | 161.0 | 161.5 | 158.4 | 160.5 | 164.7 | 169.0 | 173.5 | 178.0 |
| Accounts Payable, % | 8.85 | 8.76 | 8.77 | 9.18 | 9.03 | 8.92 | 8.92 | 8.92 | 8.92 | 8.92 |
| Capital Expenditure | -34.8 | -167.6 | -196.7 | -36.8 | -61.5 | -92.9 | -95.3 | -97.8 | -100.4 | -103.0 |
| Capital Expenditure, % | -2.06 | -7.43 | -10.71 | -2.09 | -3.5 | -5.16 | -5.16 | -5.16 | -5.16 | -5.16 |
| Tax Rate, % | 28.49 | 28.49 | 28.49 | 28.49 | 28.49 | 28.49 | 28.49 | 28.49 | 28.49 | 28.49 |
| EBITAT | 352.5 | 472.5 | 133.4 | 424.4 | 376.2 | 339.4 | 348.2 | 357.3 | 366.7 | 376.3 |
| Depreciation | ||||||||||
| Changes in Account Receivables | ||||||||||
| Changes in Inventories | ||||||||||
| Changes in Accounts Payable | ||||||||||
| Capital Expenditure | ||||||||||
| UFCF | -738.6 | 79.1 | 289.8 | 549.9 | 570.3 | 121.4 | 295.4 | 303.2 | 311.1 | 319.2 |
| WACC, % | 4.56 | 4.44 | 4.21 | 4.23 | 4.31 | 4.35 | 4.35 | 4.35 | 4.35 | 4.35 |
| PV UFCF | ||||||||||
| SUM PV UFCF | 1,174.8 | |||||||||
| Long Term Growth Rate, % | 4.00 | |||||||||
| Free cash flow (T + 1) | 332 | |||||||||
| Terminal Value | 94,583 | |||||||||
| Present Terminal Value | 76,442 | |||||||||
| Enterprise Value | 77,616 | |||||||||
| Net Debt | 15 | |||||||||
| Equity Value | 77,601 | |||||||||
| Diluted Shares Outstanding, MM | 265 | |||||||||
| Equity Value Per Share | 292.57 |
What You Will Receive
- Customizable Excel Template: A fully editable Excel-based DCF Calculator featuring pre-loaded real Weibo Corporation (WB) financials.
- Authentic Data: Access to historical figures and future projections (displayed in the highlighted cells).
- Flexible Forecasting: Adjust forecast parameters such as revenue growth, EBITDA %, and WACC.
- Instant Calculations: Quickly observe how your inputs affect Weibo Corporation's (WB) valuation.
- Professional Resource: Designed for investors, CFOs, consultants, and financial analysts.
- Intuitive Layout: Organized for simplicity and ease of navigation, complete with step-by-step guidance.
Key Features
- Pre-Loaded Data: Weibo Corporation’s historical financial statements and pre-filled forecasts.
- Fully Adjustable Inputs: Modify WACC, tax rates, revenue growth, and EBITDA margins.
- Instant Results: Observe Weibo Corporation’s intrinsic value recalculating in real time.
- Clear Visual Outputs: Dashboard charts showcase valuation results and key metrics.
- Built for Accuracy: A professional tool for analysts, investors, and finance experts.
How It Works
- Step 1: Download the prebuilt Excel template with Weibo Corporation’s (WB) data included.
- Step 2: Explore the pre-filled sheets and familiarize yourself with the key metrics.
- Step 3: Update forecasts and assumptions in the editable yellow cells (WACC, growth, margins).
- Step 4: Instantly view recalculated results, including Weibo Corporation’s (WB) intrinsic value.
- Step 5: Make informed investment decisions or generate reports using the outputs.
Why Choose Weibo Corporation (WB)?
- Save Time: Quickly access a comprehensive platform without the hassle of building from the ground up.
- Enhance Accuracy: Utilize trustworthy data and algorithms to minimize valuation discrepancies.
- Fully Customizable: Adjust the platform to align with your specific insights and forecasts.
- User-Friendly Interface: Intuitive visuals and outputs simplify data interpretation.
- Preferred by Professionals: Crafted for experts who demand both reliability and ease of use.
Who Should Use Weibo Corporation (WB)?
- Social Media Marketers: Leverage the platform to enhance brand visibility and engage with a vast audience.
- Content Creators: Utilize Weibo's tools to reach and grow your follower base effectively.
- Businesses: Quickly adapt Weibo's features for targeted advertising and customer interaction.
- Researchers: Analyze user trends and behaviors to inform studies on social media impact.
- Students and Educators: Explore social media dynamics and digital communication strategies in academic settings.
What the Template Contains
- Comprehensive DCF Model: Editable template with detailed valuation calculations for Weibo Corporation (WB).
- Real-World Data: Weibo’s historical and projected financials preloaded for analysis.
- Customizable Parameters: Adjust WACC, growth rates, and tax assumptions to test various scenarios.
- Financial Statements: Full annual and quarterly breakdowns for deeper insights into Weibo Corporation (WB).
- Key Ratios: Built-in analysis for profitability, efficiency, and leverage specific to Weibo Corporation (WB).
- Dashboard with Visual Outputs: Charts and tables for clear, actionable results related to Weibo Corporation (WB).
Disclaimer
All information, articles, and product details provided on this website are for general informational and educational purposes only. We do not claim any ownership over, nor do we intend to infringe upon, any trademarks, copyrights, logos, brand names, or other intellectual property mentioned or depicted on this site. Such intellectual property remains the property of its respective owners, and any references here are made solely for identification or informational purposes, without implying any affiliation, endorsement, or partnership.
We make no representations or warranties, express or implied, regarding the accuracy, completeness, or suitability of any content or products presented. Nothing on this website should be construed as legal, tax, investment, financial, medical, or other professional advice. In addition, no part of this site—including articles or product references—constitutes a solicitation, recommendation, endorsement, advertisement, or offer to buy or sell any securities, franchises, or other financial instruments, particularly in jurisdictions where such activity would be unlawful.
All content is of a general nature and may not address the specific circumstances of any individual or entity. It is not a substitute for professional advice or services. Any actions you take based on the information provided here are strictly at your own risk. You accept full responsibility for any decisions or outcomes arising from your use of this website and agree to release us from any liability in connection with your use of, or reliance upon, the content or products found herein.