
|
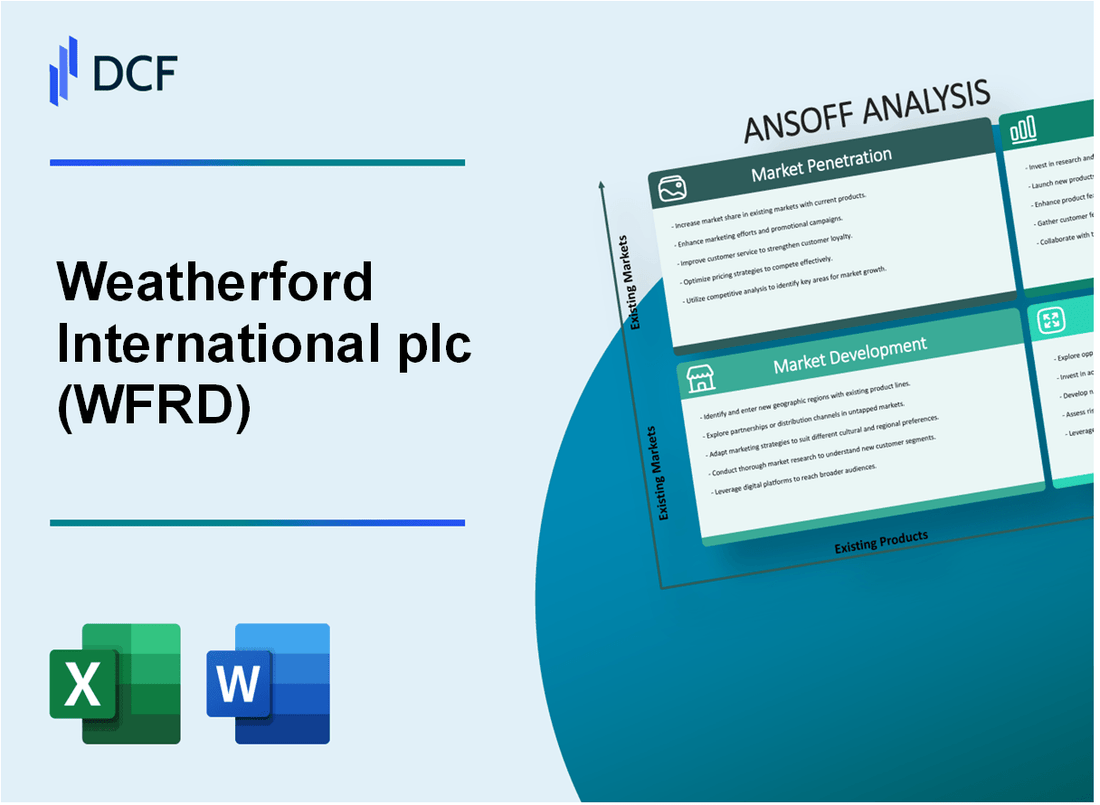
Weatherford International plc (WFRD): ANSOFF MATRIX [Dec-2025 Updated] |
Fully Editable: Tailor To Your Needs In Excel Or Sheets
Professional Design: Trusted, Industry-Standard Templates
Investor-Approved Valuation Models
MAC/PC Compatible, Fully Unlocked
No Expertise Is Needed; Easy To Follow
Weatherford International plc (WFRD) Bundle
You're looking at Weatherford International plc's path forward, aiming for that projected $4.85 billion to $4.93 billion revenue in 2025, and honestly, a simple projection isn't enough; you need a real plan. As someone who's mapped out growth for big players, I've distilled their current strengths-like focusing on margin over volume and increasing utilization of existing Drilling and Evaluation assets-into the classic Ansoff Matrix. We see clear actions: digging deeper into current markets while focusing on margin, expanding proven tech like MPD into new deepwater spots, pushing new digital tools like 'Weatherford Industrial Intelligence' to existing clients, and even adapting core tech for New Energy Solutions and CCS. This isn't just theory; it's a concrete roadmap showing exactly where Weatherford International plc can place its next dollar for growth, so let's break down the specifics below.
Weatherford International plc (WFRD) - Ansoff Matrix: Market Penetration
You're looking at how Weatherford International plc (WFRD) plans to grow by selling more of what it already offers into its current markets. This is about deepening the relationship with the clients you already serve, making sure you're the first call, and doing it profitably. The message from the top is clear: it's about the quality of the revenue, not just the quantity. The focus is definitely on margin over volume, not chasing unfavorable market share.
This focus on profitable growth is critical when you look at the bottom line. For the third quarter of 2025, the overall net income margin for Weatherford International plc stood at 6.6%. That number tells you exactly where the discipline needs to be applied across all operations to ensure every dollar of revenue contributes meaningfully.
Here's a quick look at how the main business segments stacked up in Q3 2025, which gives you the landscape for these penetration efforts:
| Segment | Q3 2025 Revenue | Revenue Share | Q3 2025 Margin |
| Well Construction and Completions (WCC) | $468 million | 38% | 26.7% |
| Drilling and Evaluation (DRE) | $346 million | 28% | 24.0% |
| Production and Intervention (PRI) | $326 million | 26% | 18.1% |
For the Drilling and Evaluation (DRE) segment, a key action is driving up the use of existing assets, especially in high-potential areas. The Middle East/North Africa/Asia region is a major contributor here, generating $533 million in total revenue for the third quarter of 2025. Getting more utilization out of the DRE equipment base in this region directly translates to better operating leverage and margin improvement, which is exactly what the strategy calls for.
When it comes to the core Well Construction and Completions (WCC) services, the goal is locking in stability. Securing more long-term contracts is the mechanism to achieve this. WCC services are a significant part of the business, accounting for 38% of the total Q3 revenue. Long-term agreements help smooth out the revenue volatility you see quarter-to-quarter, which is a huge plus for planning and cost control.
Deepening customer relationships is where the Production and Intervention (PRI) segment comes into play. The plan involves actively cross-selling PRI solutions to the existing client base that already uses WCC or DRE services. This is a classic penetration move that leverages established trust. The PRI segment posted an adjusted EBITDA margin of 18.1% in Q3 2025, so successfully cross-selling higher-margin services here will immediately help lift that rate.
Underpinning all these revenue-focused actions is a commitment to efficiency. You can't just bring in more revenue; it has to be profitable revenue. Weatherford International plc is implementing strategic cost optimization across the board to directly impact the overall profitability. The target is to see meaningful improvement from the reported Q3 2025 net income margin of 6.6%.
- Focus on margin over volume, avoiding unfavorable market share grabs.
- Drive utilization of DRE assets in the Middle East/North Africa/Asia region, which delivered $533 million in Q3 2025 revenue.
- Secure long-term contracts for WCC services, which made up 38% of Q3 revenue.
- Cross-sell PRI solutions to existing clients to improve the segment's 18.1% Q3 margin.
- Improve the overall 6.6% Q3 2025 net income margin through cost optimization.
Finance: draft 13-week cash view by Friday.
Weatherford International plc (WFRD) - Ansoff Matrix: Market Development
Weatherford International plc is currently operating in approximately 75 countries. This global footprint supports the Market Development strategy by providing a base to enter new frontier oil and gas exploration regions.
The recent success in securing a three-year, $147 million contract from Petróleo Brasileiro S.A. (Petrobras) for Tubular Running Services in Brazil demonstrates the ability to win significant work outside established core areas. This type of international contract win provides a foundation to expand Managed Pressure Drilling (MPD) services into new deepwater basins.
For context on the overall financial environment supporting this expansion, here are key figures from the latest reported period:
| Metric | Value (2025) |
| Q3 2025 Revenue | $1,232 million |
| Full Year 2025 Revenue Projection | $4.85 billion to $4.93 billion |
| Q3 2025 Adjusted EBITDA | $269 million |
| Q3 2025 Net Income | $81 million |
| North America Sequential Revenue Change (Q3) | Decreased by 9% |
Targeting emerging gas markets in Europe and Asia with existing Wireline and Well Services builds on existing activity. For instance, in Q3 2025, Europe/Sub-Sahara Africa/Russia revenue was largely flat year-over-year, with Wireline activity noted as higher in Europe. The Drilling and Evaluation (DRE) segment, which includes Wireline, saw a year-over-year decrease of 20% in Q3 2025, indicating opportunity for service expansion in these regions.
Introducing established Artificial Lift systems to smaller, independent operators in North America addresses a market segment showing softness, as North America revenue declined 9% sequentially in Q3 2025. Still, Artificial Lift activity was a driver for sequential revenue growth in the Middle East/North Africa/Asia segment in Q3 2025.
The Market Development actions include:
- Expand MPD services into deepwater basins leveraging the $147 million Petrobras contract success.
- Target emerging gas markets in Europe and Asia with existing Wireline and Well Services.
- Introduce Artificial Lift systems to smaller North American operators facing a 9% sequential revenue decline in Q3 2025.
- Leverage the global footprint across approximately 75 countries to enter new frontier exploration regions.
The company's international focus accounted for approximately 80% of revenue in Q3 2025.
Weatherford International plc (WFRD) - Ansoff Matrix: Product Development
You're looking at the hard numbers behind Weatherford International plc's push for new offerings in existing markets. This is where the rubber meets the road for their Product Development strategy.
The rollout of the Weatherford Industrial Intelligence digital portfolio is a major focus, following its showcase at the FWRD 2025 conference. While specific adoption rates across the existing customer base aren't broken out yet, the company reported over 20+ product launches in the nine months leading up to Q3 2025, signaling a significant investment in this digital layer. This platform is designed to fuse physical operations with data foundations.
For deepwater completions efficiency, the push is on for the Optimax Valve and the Magnus Saker Rotary Steerable System. The Magnus Saker RSS specifically boasts 39 upgrades from legacy rotary steerable technology, engineered for longer runs and better directional control in tough formations. The Optimax Valve, in deepwater trials, accelerated completions and reduced intervention needs, saving operators days of rig time.
Integrating the production foundational model, which is part of the broader digital suite, helps clients benchmark asset performance. The Drilling and Evaluation (DRE) segment, which houses many of these advanced tools, posted Q3 2025 revenue of $346 million with a segment adjusted EBITDA margin of 24.0%.
Commercializing the Rotaflex PowerMag System to existing Production and Intervention customers is showing early traction. In North America trials, operators reported double-digit reductions in energy costs alongside improved production efficiency, thanks to the system's combination of high-volume rod lift and a permanent magnet motor with a ForeSite Power Regenerative VSD.
Here's a quick look at the financial backdrop supporting these product development efforts as of the third quarter of 2025:
| Metric | Value (Q3 2025) | Context/Comparison |
| Q3 2025 Revenue | $1.232 billion | Up 2% sequentially |
| Q3 2025 Adjusted EBITDA | $269 million | Up 6% sequentially |
| Q3 2025 Adjusted EBITDA Margin | 21.8% | Up 74 basis points sequentially |
| Q3 2025 Adjusted Free Cash Flow | $99 million | Up 25% sequentially |
| Full Year 2025 Revenue Guidance Midpoint | $4.89 billion | Range of $4.85 - $4.93 Billion |
| WCC Segment Revenue (Includes Completions) | $468 million | 38% of total Q3 revenue |
The strategic focus is clear, and the company is backing it with capital allocation decisions. For the nine months ended September 30, 2025, Weatherford International plc repurchased shares for approximately $94 million, alongside paying $54 million in dividends, totaling $148 million returned to shareholders.
You can see the commitment to these new technologies reflected in the segment performance, too. The Well Construction and Completions (WCC) segment, where systems like Optimax and Magnus Saker fit, posted a Q3 2025 margin of 26.7%.
The company's overall liquidity remains strong, with reported liquidity around $1.6 billion at the end of Q3 2025.
- Digital Portfolio launch event: FWRD 2025 Conference.
- Magnus Saker RSS upgrades: 39.
- Rotaflex PowerMag energy cost reduction: double-digit percentage.
- Total shareholder return (9M 2025): $148 million.
Finance: draft 13-week cash view by Friday.
Weatherford International plc (WFRD) - Ansoff Matrix: Diversification
You're looking at how Weatherford International plc (WFRD) can pivot its existing deep-well expertise into adjacent, non-traditional energy markets. This is the Diversification quadrant of the Ansoff Matrix, and for WFRD, it means applying established drilling, evaluation, and monitoring technology to sectors like geothermal and carbon capture.
The core business is still substantial, which provides the capital base for this expansion. For instance, Weatherford International plc reported third quarter 2025 revenue of $1,232 million, with an adjusted EBITDA margin of 21.8% in that quarter. Management projected full-year 2025 revenues to be between $4.7 billion and $4.9 billion. This financial footing supports the necessary R&D and commercial push into new areas.
Aggressively Market 'New Energy Solutions' to Geothermal
Weatherford International plc has already branded its geothermal efforts under the 'New Energy Solutions' division. The key here is leveraging existing drilling expertise, such as Managed Pressure Drilling (MPD) solutions, which were field-proven in the Middle East's first deep geothermal exploration wells back in 2024. You need to aggressively push these proven capabilities into the geothermal sector, which already uses similar well construction methodologies.
The opportunity is significant when you look at the broader energy transition. While Weatherford International plc's Q3 2025 revenue was $1,232 million, the market for related technologies is growing. For example, the global hydrogen sensor market is projected to grow at a Compound Annual Growth Rate (CAGR) of 13.0% from 2025 to 2031. This signals strong investment in the clean energy infrastructure that geothermal supports.
Adapt Fiber-Optic Sensing for CCS Well Integrity
Your fiber-optic sensing and downhole monitoring technology, like the ForeSite Sense optical system, is a direct bridge to Carbon Capture and Storage (CCS) well integrity monitoring. Weatherford International plc already demonstrated this by using the ForeSite Sense system to deliver continuous, real-time Pressure/Temperature (P/T) insight during a CO2 injection phase for an energy customer in France.
This technology directly addresses the need to monitor and verify CO2 storage reservoir and caprock integrity. Furthermore, technologies like SecureTrac™ have already completed 17 field trials, indicating a move beyond pure research and development toward commercial application in this space. This is a clear product development play using existing digital and evaluation assets.
Strategic Joint Ventures for Non-Oil and Gas Infrastructure
To apply core drilling expertise to non-oil and gas infrastructure, like deep underground storage or mining, joint ventures are defintely the fastest route. This allows Weatherford International plc to access specialized geological knowledge or local regulatory expertise without building it all internally. The company is already focused on strategic partnerships to accelerate digital transformation.
The company's Drilling and Evaluation (DRE) segment generated revenue of $346 million in Q3 2025. A successful JV could see a portion of this segment's expertise-like directional drilling or well construction-re-allocated to these new infrastructure projects, creating a new, stable revenue stream insulated from oil price volatility.
Develop Specialized Tools for Hydrogen Storage Wells
Leveraging existing High-Pressure, High-Temperature (HPHT) sensor capabilities for hydrogen storage wells is a natural extension. Weatherford International plc offers services related to HPHT sensors. The market opportunity here is substantial, as the global hydrogen storage market was valued at USD 1.9 billion in 2024.
While the specific revenue for a new hydrogen storage tool isn't public yet, you can see the market is primed. The broader hydrogen sensor market is expected to grow significantly. Your existing technology for extreme well conditions is directly transferable to the high-pressure requirements of hydrogen storage wells, making this a low-risk product enhancement.
Here's a quick comparison of the current financial footing versus the potential scale of these new energy markets you're targeting:
| Metric/Market | Weatherford International plc (WFRD) Q3 2025 Financials | External Market Size/Growth (2025 Est.) |
| Revenue (Quarterly) | $1,232 million | N/A |
| Adjusted EBITDA Margin (Q3) | 21.8% | N/A |
| Geothermal/CCS Technology Application | MPD deployed in deep geothermal wells (2024) | CCS SecureTrac™ trials completed: 17 |
| Hydrogen Storage Tool Opportunity | Offers HPHT sensor capabilities | Hydrogen Storage Market Value (2024): USD 1.9 billion |
| Hydrogen Sensor Market Growth | N/A | CAGR (2025-2031): 13.0% |
You should map the R&D spend for the Industrial Intelligence Digital Portfolio, launched in Q3 2025, directly against the potential revenue capture from these four diversification vectors. Finance: draft 13-week cash view by Friday.
Disclaimer
All information, articles, and product details provided on this website are for general informational and educational purposes only. We do not claim any ownership over, nor do we intend to infringe upon, any trademarks, copyrights, logos, brand names, or other intellectual property mentioned or depicted on this site. Such intellectual property remains the property of its respective owners, and any references here are made solely for identification or informational purposes, without implying any affiliation, endorsement, or partnership.
We make no representations or warranties, express or implied, regarding the accuracy, completeness, or suitability of any content or products presented. Nothing on this website should be construed as legal, tax, investment, financial, medical, or other professional advice. In addition, no part of this site—including articles or product references—constitutes a solicitation, recommendation, endorsement, advertisement, or offer to buy or sell any securities, franchises, or other financial instruments, particularly in jurisdictions where such activity would be unlawful.
All content is of a general nature and may not address the specific circumstances of any individual or entity. It is not a substitute for professional advice or services. Any actions you take based on the information provided here are strictly at your own risk. You accept full responsibility for any decisions or outcomes arising from your use of this website and agree to release us from any liability in connection with your use of, or reliance upon, the content or products found herein.