
|
Cactus, Inc. (WHD): PESTLE Analysis [Nov-2025 Updated] |
Fully Editable: Tailor To Your Needs In Excel Or Sheets
Professional Design: Trusted, Industry-Standard Templates
Investor-Approved Valuation Models
MAC/PC Compatible, Fully Unlocked
No Expertise Is Needed; Easy To Follow
Cactus, Inc. (WHD) Bundle
Cactus, Inc. (WHD) is poised for a strong 2025, with analyst projections showing revenue near $1.35 Billion and Net Income around $320 Million, fueled by an expected 15% rise in E&P capital expenditure. But that growth is fragile; you can't just look at the balance sheet without mapping the external forces, so we need to break down the PESTLE factors. Geopolitical stability, the demand for 20,000 PSI wellhead systems, and the tightening grip of ESG reporting are all converging, creating both serious risks and clear opportunities for this wellhead leader. Let's look at the defintely critical macro-environment shaping their strategy.
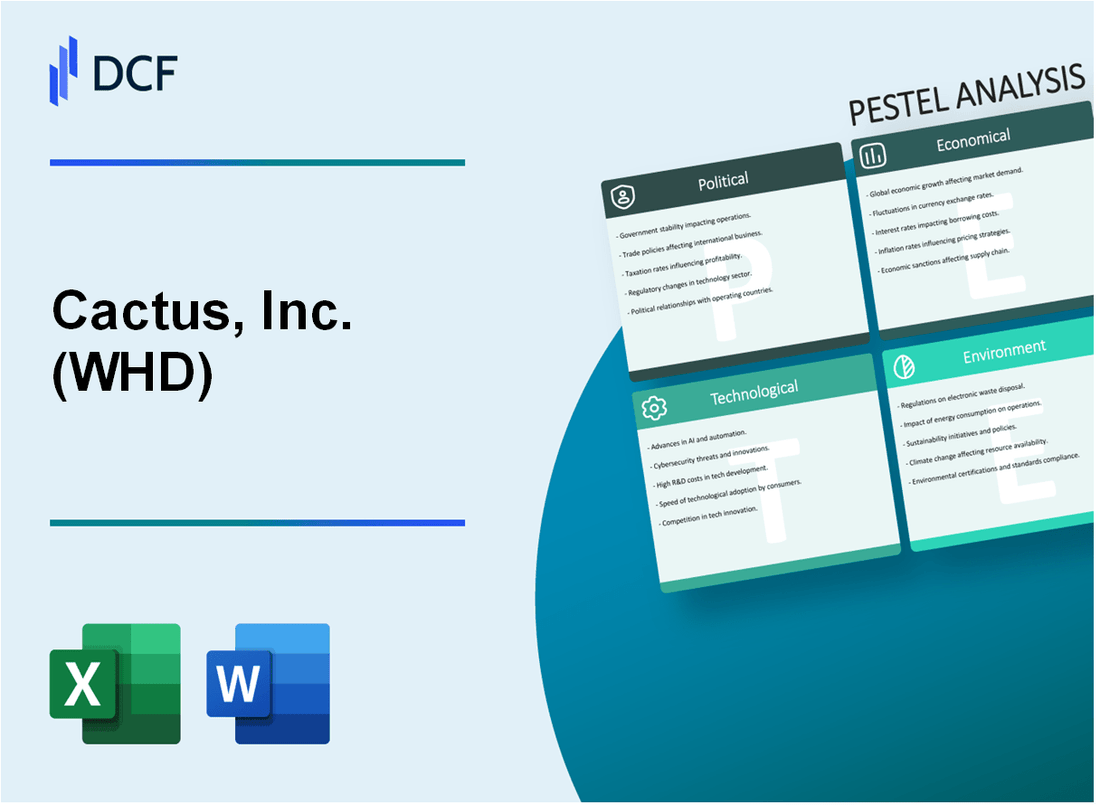
Cactus, Inc. (WHD) - PESTLE Analysis: Political factors
The political environment for Cactus, Inc. (WHD) in 2025 is defined by a significant, industry-favorable shift in US federal policy, primarily centered on deregulation and expedited energy production. This change creates a clear near-term opportunity for increased domestic drilling activity, which directly boosts demand for Cactus's wellhead and pressure control equipment. You need to focus on how quickly your customers-the Exploration & Production (E&P) companies-can convert these new permits into actual drilling programs.
Federal permitting reform accelerates drilling approvals
The new administration, starting in January 2025, has made energy production a top priority, leading to a tangible acceleration in federal permitting. Executive Orders signed early in the year directed agencies to remove regulatory barriers and expedite projects, which is a major tailwind for Cactus's core market. This is defintely a game-changer for lead times.
The most concrete evidence of this shift is the surge in approvals by the Bureau of Land Management (BLM). Between January 20 and October 7, 2025, the BLM approved 4,483 Applications for Permits to Drill (APDs) on federal and Native American land. This represents a massive 73% increase compared to the same period in 2024. Furthermore, the Energy Permitting Reform Act of 2024 (EPRA) lengthened the duration of drilling permits from three years to four years, giving E&P operators more flexibility to schedule their activity and stockpile permits, reducing the risk of expiration.
Here's a quick look at the impact on the approval process:
- APD Approvals (Jan-Oct 2025): 4,483 permits.
- Year-over-Year Increase: 73% surge in approvals.
- Permit Duration: Extended from 3 years to 4 years.
- Judicial Review: EPRA includes provisions to expedite legal challenges to federal decisions.
Potential for new EPA methane emission standards impacting operations
While environmental standards remain a long-term political risk, the immediate financial threat from new methane regulations has been significantly curtailed in 2025. The Environmental Protection Agency (EPA) finalized new rules (NSPS OOOOb/EG OOOOc) in 2024, but their implementation has been delayed.
Crucially, Congress repealed the Waste Emissions Charge (WEC) until 2034 in March 2025, a major political victory for the oil and gas industry. The WEC, which was a core component of the Inflation Reduction Act, would have imposed a significant financial penalty on high-emitting facilities. For 2025, this charge was set to increase to $1,200 per tonne of methane emissions exceeding specified thresholds. The repeal removes this direct, high-cost compliance risk for Cactus's customers, which in turn supports their capital expenditure (CapEx) budgets. This is a huge cost saving for operators.
Geopolitical stability affects global oil demand and pricing
Geopolitical instability continues to be the primary driver of volatility in global oil prices, directly influencing the E&P CapEx decisions that fuel Cactus's revenue. The ongoing conflicts in Eastern Europe and persistent tensions in the Middle East keep a risk premium in the market. Still, a projected supply surplus is keeping prices in check.
Analyst consensus for 2025 suggests that oil prices will remain relatively stable, but susceptible to shocks. The International Energy Agency (IEA) projects global oil demand growth of approximately 680,000 barrels per day (bpd), but this is expected to be offset by a supply surplus of around 1.2 million bpd in the overall market. This structural oversupply acts as a ceiling on prices, which is why the baseline forecasts are moderate. For Cactus, lower-but-stable prices are better than high volatility.
| 2025 Oil Price Forecast (Full Year Average) | Price Per Barrel | Key Driver |
|---|---|---|
| Brent Crude (BMI/Fitch Solutions) | $68.50 | Geopolitical risk premium offset by supply surplus. |
| WTI Crude (Standard Chartered) | $65.40 | Increased US shale production and moderating global demand. |
| Oil Supply Surplus (IEA) | 1.2 Million bpd | Non-OPEC production growth, especially US shale. |
US-China trade tensions influence raw material supply chains
US-China trade tensions remain a critical, albeit indirect, political risk for Cactus's supply chain. While a temporary trade truce was reached in late October 2025, the underlying conflict over critical technology and raw materials persists. Cactus's high-pressure equipment relies on components that use specialized metals and electronics, many of which originate in or are processed through China.
In 2025, China expanded its export controls on several critical raw materials in response to US tariff increases. This directly impacts the cost and availability of key inputs for the oilfield services sector:
- Rare Earth Metals: China controls over 90% of global production.
- Gallium: China accounts for 98.7% of global production.
- Silicon: China accounts for 76.3% of global production, a base for modern electronics.
The US effective tariff rate on Chinese goods is expected to approach 20%, even with the temporary truce. This tariff pressure, combined with China's export controls, means Cactus faces potential cost inflation and supply chain bottlenecks for components, which could squeeze the Net Income of $320 Million projected for 2025 if not managed effectively. You need to model a 5% to 10% increase in raw material costs for 2026.
Economically, the picture is strong, but watch the cost of capital. Analyst consensus projects Cactus, Inc. (WHD) will hit revenue of approximately $1.35 Billion and a Net Income of $320 Million for the 2025 fiscal year. That growth is fueled by E&P (Exploration & Production) CapEx, which we expect to rise around 15% this year. Still, high interest rates are a headwind.
Cactus, Inc. (WHD) - PESTLE Analysis: Economic factors
The economic landscape for Cactus, Inc. (WHD) in 2025 is defined by a paradox: upstream client discipline is keeping a lid on explosive spending, but a stable, elevated oil price floor is ensuring consistent, profitable drilling activity. This environment favors efficient, low-cost suppliers like Cactus, but the high cost of capital and persistent inflation on materials still squeeze margins.
You need to focus on how the stability in oil prices is offset by the rising cost of doing business, which is the real near-term risk. Cactus's strong balance sheet, with $347.7 million in cash and no bank debt as of Q1 2025, is a major competitive advantage here. That's a huge buffer against a tight credit market.
E&P capital expenditure (CapEx) expected to rise 15% in 2025.
The market's initial hope for a massive CapEx boom-the '15% rise' many analysts projected-has been tempered by E&P fiscal discipline. The reality for 2025 is far more nuanced: US E&P spending is actually projected to decline by 3.2% overall, as the majors prioritize shareholder returns over pure production growth.
However, the smaller, private operators, which are key customers for Cactus, are still in growth mode, with their CapEx expected to increase by a modest but crucial 4.3% in 2025. This is where Cactus's focus on capital-efficient wellhead systems really pays off. Global CapEx is essentially flat, projected to reach approximately $535 billion, only slightly up from 2024. So, growth is selective, not universal.
WTI crude price stability near $88/barrel supports drilling budgets.
While the $88/barrel WTI crude price level is not the 2025 average, the current price environment is stable enough to support robust drilling economics. The US Energy Information Administration (EIA) forecasts the average WTI price for 2025 to be around $70.31 per barrel. This price point is well above the average break-even costs for most US shale plays, which is the key metric for Cactus's customers. This stability, rather than a price spike, is what underpins the predictable demand for wellhead and pressure control equipment.
The market is prioritizing cash flow over chasing a boom, so that $70.31 average is a good, reliable floor. This conservative price outlook is why Cactus can rely on a consistent revenue stream, which hit $280.3 million in Q1 2025.
High interest rates increase the cost of capital for expansion projects.
High interest rates are a structural headwind for the entire oilfield services sector, making large-scale expansion projects more expensive. The US Bank Prime Loan Rate sits at 7.00% as of November 2025, a level that significantly increases the cost of debt for clients needing to finance new rigs or major field development. This environment favors companies like Cactus that have minimal debt and can fund their capital expenditures internally.
For perspective, the Federal Funds Rate target range is currently 3.75%-4.00%. This tight monetary policy means that any E&P company without a pristine balance sheet will think twice before committing to a multi-year project, keeping the pressure on service providers to maintain pricing discipline. Cactus's Q1 2025 net capital expenditures were only $15.5 million, showing a very controlled approach to growth.
Inflationary pressures on steel and labor costs remain a concern.
Inflation is not just a consumer problem; it's a direct cost driver for Cactus. The company is a manufacturer of steel-intensive products, and the Dallas Fed Energy Survey's Oilfield Services Input Cost Index advanced to 30.9 in Q1 2025, indicating a faster pace of cost increases. The Lease Operating Expenses Index for E&P firms also rose sharply to 38.7 in the same period, signaling higher costs for Cactus's field services segment.
The US annual Consumer Price Index (CPI) stood at 3.0% in September 2025, reflecting persistent underlying price pressures. Specifically, the labor market remains tight, with the job vacancies to unemployment ratio (V/U) at 1.1 in early 2025, which continues to support wage growth-a necessary but costly reality for retaining skilled field crews.
Key Economic and Financial Metrics for Cactus, Inc. (WHD) - 2025
| Metric | Value (2025 Data) | Source/Context |
|---|---|---|
| WHD Trailing-Twelve-Month (TTM) Revenue | $1.11 Billion USD | Full-year 2025 projection/TTM. |
| WHD Q1 2025 Revenue | $280.3 million | First Quarter 2025 Actual. |
| WHD Q1 2025 Adjusted EBITDA | $93.8 million | First Quarter 2025 Actual. |
| WHD Cash and Equivalents (Mar 31, 2025) | $347.7 million | Strong liquidity with no bank debt. |
| US Bank Prime Loan Rate (Nov 2025) | 7.00% | Benchmark for corporate borrowing costs. |
| WTI Crude Oil Price Forecast (2025 Avg) | $70.31 per barrel | EIA forecast, supporting drilling economics. |
| US E&P CapEx Growth (2025) | -3.2% (Decline) | Overall US spending, reflecting fiscal discipline. |
| Oilfield Services Input Cost Index (Q1 2025) | 30.9 | Dallas Fed Survey, indicating rising input costs. |
Sociologically, the pressure is on the 'S' and 'G' in ESG (Environmental, Social, and Governance). Investors are demanding more than just profits; they want to know how Cactus is managing its workforce and community impact. Workforce shortages in specialized roles are a real cost driver. This is a defintely a factor to track.
Here's the quick math: with a 7.00% Prime Rate, the cost of a $100 million expansion loan is significantly higher than in the recent past, so E&P companies are demanding more capital efficiency from their suppliers, which is Cactus's core strength.
The key action for you is to monitor the spread between WTI crude and the oilfield services input cost index; if WTI dips below $65/barrel while the cost index remains above 30, Cactus's margins will erode quickly.
Cactus, Inc. (WHD) - PESTLE Analysis: Social factors
The social landscape for an oilfield services company like Cactus, Inc. is less about consumer fads and more about two critical, high-stakes issues: talent and public trust. You are operating in a sector where the demand for specialized equipment is high, but the social license to operate (SLO) is under constant review. Ignoring these social shifts is a direct path to higher operating costs and capital constraints.
Here's the quick math: a tight labor market plus intense public scrutiny on water management means your operational efficiency and your access to capital are directly tied to your social performance.
Investor demand for transparent ESG reporting is intensifying.
Investors are no longer satisfied with a nice story; they demand concrete, financially material Environmental, Social, and Governance (ESG) data. By 2025, this has moved from a voluntary exercise to a baseline requirement for maintaining investor trust and capital access. Institutional investors are actively looking for ESG signals that demonstrate business resilience and long-term profitability, especially in the oil and gas sector.
If you cannot credibly report on your social and environmental impact, you risk investor divestment and loss of social license to operate. This is why companies are embedding ESG performance into core metrics. For Cactus, Inc., this means clear, auditable disclosures on safety incidents, supply chain labor practices, and community engagement are becoming as important as your earnings per share.
Workforce shortages in specialized oilfield services roles persist.
The industry is facing a paradox: a surge in activity in key basins like the Permian, but a structural shortage of specialized talent. While Texas upstream employment climbed by 7,300 jobs (a 3.6% increase) through the first five months of 2025, reaching 208,200 upstream jobs in May, the national oil and gas extraction sector still saw a decline from 123,100 employees in January 2025 to 119,100 in August 2025.
The real challenge is the long-term pipeline. The energy industry is projected to lack up to 40,000 competent workers by 2025. Plus, the next generation is skeptical: 62% of Gen Z and Millennials find a career in oil and gas unappealing, which compounds the shortage of field engineers and technicians needed to run your advanced wellhead and pressure control equipment. You need to compete with tech and renewables for talent with niche expertise in automation and digital oilfield services.
Here is a snapshot of the labor market challenge:
| Metric | 2025 Data / Trend | Implication for Cactus, Inc. |
|---|---|---|
| U.S. Oil & Gas Extraction Employment (Jan-Aug 2025) | Declined from 123,100 to 119,100 employees | Higher wage pressure and difficulty staffing field service crews. |
| Projected Competent Worker Shortage (2025) | Up to 40,000 workers in the energy industry | Increased risk of operational delays and safety incidents due to understaffing. |
| Gen Z/Millennial Appeal | 62% find an oil & gas career unappealing | Long-term talent pipeline is defintely at risk, requiring major investment in employer branding. |
Public scrutiny on hydraulic fracturing water management is high.
Water management is the most visible environmental and social flashpoint in the Permian Basin. The region is on track to produce over 6.5 million barrels of oil per day in 2025, which generates massive volumes of produced water-the wastewater that comes up with the oil and gas. This volume is projected to stress disposal facilities, with Permian produced water volumes expected to exceed 26 million barrels per day by 2030.
The public concern is twofold: the use of freshwater for fracking and the seismic activity linked to saltwater disposal wells (SWDs). While Cactus, Inc. is an equipment provider, not a water management company, your customers' operations are directly impacted. The industry is shifting, with water recycling on track to meet over 77% of fracking water demand by 2030. This trend creates an opportunity for your high-pressure equipment, but it also means your products must be compatible with the increasingly complex logistics of water reuse.
Focus on local community engagement in Permian Basin operations.
Because Cactus, Inc. operates extensively in the Permian Basin, local community relations are a non-negotiable social factor. The sheer scale of oilfield activity has strained local infrastructure, housing, and social services. Companies in the region are actively working to mitigate these impacts, with major operators joining groups like the Permian Strategic Partnership (PSP) to improve the quality of life.
For Cactus, Inc., effective engagement means more than just philanthropy; it's about being a responsible local employer and partner.
- Sponsor local technical training programs to address the 40,000 worker shortage.
- Ensure your field operations and logistics minimize disruption to local roads and community life.
- Highlight your safety record, as the social aspect of ESG demands a focus on worker health and community well-being.
You need to show up as a long-term partner, not just an extractor of resources.
Cactus, Inc. (WHD) - PESTLE Analysis: Technological factors
The technological landscape for Cactus, Inc. is defined by a push toward extreme-pressure equipment and a strategic pivot to digital solutions and advanced materials. This isn't just about incremental improvements; it's about engineering for environments that were previously inaccessible, and doing it with greater efficiency and less risk.
Demand for 20,000 PSI wellhead systems for HPHT wells
The industry is defintely moving toward deeper, hotter reservoirs, which means the High-Pressure/High-Temperature (HPHT) segment is becoming a major growth driver. Cactus, Inc. is positioned to capitalize on this, as they are a key player introducing this type of advanced equipment. The global wellhead equipment market is projected to be valued at approximately $7.38 billion in 2025, and the demand for ultra-HPHT equipment, which requires a 20,000 pounds per square inch (PSI) rating, is a critical component of that growth.
For context, if a well's pressure is anticipated to be 16,000 PSI, a 20,000 PSI wellhead system is mandatory for approval and safe operation, especially in areas like the Gulf of Mexico (GOM). This isn't a niche market anymore; it's the new frontier in deepwater and unconventional plays. Cactus's core Pressure Control segment, which generated $168.71 million in revenue in Q3 2025, is directly tied to meeting this escalating pressure requirement.
Digitalization of wellsite operations via remote monitoring
Digitalization, or the Industrial Internet of Things (IIoT), is reshaping wellsite operations by moving from reactive maintenance to predictive maintenance. Cactus and its peers are integrating Internet of Things (IoT) and Artificial Intelligence (AI) into wellhead systems to allow for real-time monitoring and advanced sealing technology.
This shift helps operators detect small issues before they become catastrophic failures, which is vital in high-risk HPHT environments. The underlying market for the necessary components, such as Temperature and Pressure Composite Sensors, is estimated at about $1.5 billion in 2025, showing the scale of investment in this area. This is a critical opportunity for Cactus's technology segment to integrate its equipment with operator data platforms, moving beyond just selling hardware to selling a complete, monitored safety system.
Adoption of automated pressure control equipment reduces human error
The push for automation in pressure control is a direct response to the shrinking margin for error in complex drilling. Automated equipment reduces the reliance on manual intervention, which is the primary cause of human error and non-productive time (NPT) on the rig. For Cactus, this means their pressure control equipment needs to be smarter and more integrated.
The efficiency gains from these technological and operational improvements are already visible in the financials. The company's overall Adjusted EBITDA margin rose to 32.9% in Q3 2025, up from 31.7% in Q2, partly due to organizational right-sizing and cost reduction efforts that complement the higher-efficiency equipment. The goal is simple: make the equipment so reliable and automated that the risk of a multi-million dollar failure drops to near zero.
R&D investment in lighter, more durable composite materials
The extreme conditions of HPHT wells-pressures up to 20,000 PSI and temperatures over 400°F-mean traditional steel and alloys are reaching their material limits. This necessitates a significant investment in research and development (R&D) for new materials, particularly composites and advanced thermoplastics, which offer superior strength-to-weight ratios and corrosion resistance.
Cactus's investment in this area is primarily channeled through its Spoolable Technologies segment (FlexSteel), which uses composite-reinforced pipe. The company is backing this up with capital, earmarking full-year 2025 net capital expenditures in the range of $40 to $45 million, which includes supply chain diversification and efficiency improvements. In Q3 2025 alone, $8.2 million in net capital expenditures were primarily directed toward upgrades within the Spoolable Technologies segment, underscoring the importance of this material science advantage.
| Technological Investment Area | 2025 Financial/Market Metric | Strategic Impact for Cactus, Inc. |
|---|---|---|
| 20,000 PSI HPHT Wellheads | Global Wellhead Market: ~$7.38 billion (2025 projection) | Accessing ultra-HPHT reserves; driving Pressure Control segment revenue (Q3 2025: $168.71 million). |
| Digitalization/Remote Monitoring (IIoT) | Composite Sensor Market: ~$1.5 billion (2025 estimate) | Enabling predictive maintenance; integrating hardware with software/data services. |
| Advanced Materials (Composites) | FY 2025 Net Capital Expenditures: $40-$45 million (Targeted investment) | Enhancing durability and longevity of Spoolable Technologies products for harsh environments. |
Here's the quick math on the capital allocation: the Q3 2025 net CapEx of $8.2 million going mostly to Spoolable Technologies shows a clear prioritization of composite-based solutions for future growth. The risk is that if the industry's adoption of these new technologies slows, or if a competitor's material science leapfrogs their FlexSteel product, that capital investment could be underutilized. Still, the current trajectory suggests these investments are necessary to maintain a competitive edge.
Cactus, Inc. (WHD) - PESTLE Analysis: Legal factors
The legal landscape for Cactus, Inc. is characterized by a significant increase in regulatory scrutiny across domestic operations and a complex, growing compliance burden for its expanding international footprint. You need to focus your risk management on two areas: the rising cost of domestic regulatory compliance and the geopolitical risk of global trade sanctions.
Increased state-level regulation on saltwater disposal (SWD) wells.
The most immediate regulatory pressure comes from state-level actions targeting the disposal of produced water, specifically saltwater disposal (SWD) wells. While Cactus does not operate these wells, its primary customers-Exploration & Production (E&P) companies-bear the cost, which directly impacts their drilling economics and, consequently, their demand for Cactus's wellhead and pressure control equipment.
In the Permian Basin, the Texas Railroad Commission (RRC) significantly tightened permitting guidelines effective June 1, 2025. These changes, driven by concerns over seismic activity and water migration, force operators to spend more time and capital on compliance. The new rules include:
- Expanded Area of Review (AOR) from a quarter mile to a half mile around new well completions.
- New limits on the maximum injection pressure based on local geology.
- Limits on the maximum daily injection volume tied to reservoir pressure.
This regulatory shift increases produced-water disposal costs in the Permian, which is the core market for Cactus. Any cost increase for an E&P company means less capital is available for new drilling and completion, which is defintely a headwind for equipment sales.
OSHA enforcement on wellsite safety protocols is tightening.
The Occupational Safety and Health Administration (OSHA) is increasing its enforcement focus on wellsite safety, and the financial stakes for non-compliance are materially higher in 2025. The annual inflation adjustment to civil penalties, effective January 15, 2025, means the cost of safety lapses is up across the board. This forces Cactus to invest more heavily in training, safety protocols, and compliance documentation for its field service teams.
Here's the quick math on the increased financial risk:
| OSHA Violation Type | Maximum Penalty per Violation (Effective Jan. 15, 2025) |
|---|---|
| Serious / Other-Than-Serious | $16,550 |
| Failure to Abate | $16,550 per day |
| Willful or Repeated | $165,514 |
One clean one-liner: Safety compliance is now a six-figure risk per incident.
Intellectual property (IP) protection is vital for proprietary equipment.
Cactus's competitive advantage rests on its proprietary wellhead and pressure control equipment designs. Protecting this intellectual property (IP) is a constant, expensive legal battle. You can see this risk manifest directly in the company's financial and legal disclosures.
For example, Cactus Wellhead, LLC, a subsidiary, filed a patent infringement case in the District Court, E.D. Texas, in December 2024 against major competitors like Cameron International Corporation and Schlumberger Technology Corporation. This type of litigation is costly and resource-intensive, but it's essential to maintain market exclusivity for its technology.
The financial impact of this is visible in the 2025 results. In Q1 2025, operating income margins decreased partly due to reserves taken in connection with litigation claims. While the company later reported 'reduced legal expenses' helping Q3 2025 Pressure Control operating income margins improve, the ongoing litigation risk is a perpetual line item in the $76 million in Current Accrued Expense reported as of September 30, 2025.
Compliance with international trade sanctions for global sales.
The company is strategically expanding its international presence, which immediately ratchets up the compliance complexity around global trade sanctions (Office of Foreign Assets Control - OFAC, EU, etc.). The planned acquisition of a 65% interest in Baker Hughes' Surface Pressure Control Business (SPC), which generates approximately 85% of its revenues internationally (primarily Middle East), is a game-changer for geographic diversification but also for legal risk.
The sanctions environment is acutely volatile in late 2025:
- US sanctions designations rose to over 17,000 entities and individuals by mid-2025, a 25% increase since 2023.
- In October 2025, the US sanctioned Russia's two largest oil companies, Rosneft and Lukoil, with an associated wind-down deadline of November 21, 2025.
- Compliance teams across the energy sector report a 34% higher cost managing multi-jurisdictional sanctions conflicts in 2025.
The SPC business brings a $600+ million product and aftermarket service backlog (as of December 31, 2024), but serving those international markets requires a world-class, constantly updated compliance program to avoid massive fines and reputational damage from dealing with sanctioned entities or jurisdictions.
The environmental block is all about risk mitigation and efficiency. The push to reduce operational Scope 1 and 2 emissions is non-negotiable for major E&P clients. This means Cactus's equipment must facilitate minimal land disturbance and efficient water recycling.
Next step: Operations and Finance must collaborate on a detailed compliance cost forecast for 2026, specifically modeling the 34% higher sanctions compliance cost against the expected international revenue from the SPC acquisition.
Cactus, Inc. (WHD) - PESTLE Analysis: Environmental factors
Pressure to reduce operational Scope 1 and 2 greenhouse gas emissions.
You need to recognize that the pressure to cut direct (Scope 1) and indirect (Scope 2) greenhouse gas (GHG) emissions is no longer a soft, long-term goal; it is a near-term compliance and capital risk. As a key equipment and services provider, Cactus, Inc. (WHD) is increasingly being scrutinized by its E&P (Exploration and Production) customers, who are themselves under immense investor pressure to decarbonize. While Cactus, Inc. does not directly drill, its manufacturing and field service operations-especially its fleet and facilities-are subject to this push.
The most immediate regulatory driver is the mandate for public disclosure. For fiscal year 2025, companies meeting certain criteria must prepare their Scope 1 and Scope 2 GHG emissions data for reporting and limited assurance verification by mid-2026, driven by regulations like California's SB 253. This means the data collection and internal controls need to be rock-solid now. A peer company, SM Energy, has already demonstrated a 26% reduction in its Scope 1 and Scope 2 GHG emissions intensity from its 2019 baseline, setting a clear industry benchmark for performance. Your investors are watching for a similar commitment and quantifiable results.
Here's the quick math on the investment capacity: Cactus, Inc. has a full-year 2025 net capital expenditure (CapEx) outlook in the range of $40 million to $45 million. A portion of this CapEx should be strategically earmarked for fleet upgrades, facility energy efficiency, and better data tracking systems to address this emissions pressure. It's not just an environmental cost; it's an operational efficiency play.
Focus on minimizing spills and land disturbance at well sites.
The core of Cactus, Inc.'s business-wellhead and pressure control equipment-is fundamentally about safety and containment, which directly translates to minimizing environmental incidents like spills and land disturbance. The equipment is critical for managing high-pressure environments, so any failure immediately becomes an environmental liability for the customer and a reputational risk for the supplier.
Minimizing land disturbance is a major focus for operators in the Permian Basin and other key US land markets. The trend is toward smaller, more efficient well pads and multi-well drilling, which requires more compact and reliable equipment. Cactus, Inc.'s product design, which emphasizes smaller footprint and rapid installation, is a competitive advantage here. The pressure is on to ensure that the field service operations, which support the equipment, also adhere to stringent operational protocols to prevent even minor non-reportable spills. One clean one-liner: Operational excellence is environmental compliance.
Water recycling technologies are essential for sustainable operations.
Water management is arguably the most critical environmental factor in US unconventional oil and gas, particularly in arid regions like the Permian. While Cactus, Inc. is an equipment provider and not an operator, its products and services are integral to the completion phase, which is water-intensive. The industry is rapidly moving toward a closed-loop system for produced water.
The standard is shifting: a key industry player reported recycling 40% of its produced water in 2024. For Cactus, Inc., the opportunity lies in supporting this trend through its Spoolable Technologies segment, which provides pipe for water transfer and reuse. The market for water recycling technologies is seeing massive innovation, including:
- Electro-Ceramic Desalination (ECD): New membrane solutions that can treat complex wastewater, potentially cutting operational costs by up to 30%.
- Supercritical Water Oxidation (SCWO): Advanced systems that destroy contaminants like PFAS, yielding a clean water stream for reuse.
The company's Q1 2025 revenue of $280.3 million and its strong balance sheet give it the financial muscle to invest in or partner with these water technology innovators, helping its customers meet their sustainability goals and creating a new revenue stream.
Stricter reporting requirements for fugitive emissions.
Fugitive emissions-unintended leaks of methane and other GHGs from valves, pipes, and equipment-are a high-profile target for regulators. The US Environmental Protection Agency (EPA) and state agencies are tightening rules, mandating more frequent and sophisticated Leak Detection and Repair (LDAR) programs. Since Cactus, Inc. designs and manufactures the wellhead and pressure control equipment, the integrity of its seals and components is directly tied to the client's fugitive emissions profile.
The industry is moving toward continuous monitoring technologies, replacing the older, periodic manual inspections. This creates a market opportunity for Cactus, Inc. to integrate advanced, low-leak technology into its product line. The acquisition of Baker Hughes' Surface Pressure Control business (SPC) in 2025, which has a significant international footprint, will only amplify this reporting challenge, as global standards for methane emissions are also tightening. The immediate action is a comprehensive audit of all product lines to quantify the typical leak rate (a Scope 3 emission for Cactus, Inc., but a critical Scope 1 for the customer) and to integrate next-generation sealing technology.
The table below outlines the environmental pressures and the corresponding strategic actions for Cactus, Inc. in the 2025 operating environment.
| Environmental Pressure/Risk | 2025 Regulatory/Industry Context | Strategic Action for Cactus, Inc. |
|---|---|---|
| Pressure to reduce Scope 1 & 2 GHG Emissions | California SB 253 requires FY 2025 data for Scope 1 & 2 to be reported by mid-2026. Peer companies show 26% intensity reduction. | Invest CapEx (part of the $40M-$45M 2025 outlook) in energy efficiency for manufacturing and field service fleets. Establish a verifiable 2025 Scope 1 & 2 baseline. |
| Focus on minimizing spills and land disturbance | Operator demand for smaller well pads and multi-well drilling efficiency. Zero-spill mandates at customer sites. | Promote smaller-footprint equipment design and implement mandatory, auditable spill prevention training for all field service personnel. |
| Water recycling technologies are essential | Industry benchmark for produced water recycling is reaching 40%. New technologies can cut operational costs by up to 30%. | Increase R&D or partnership focus on Spoolable Technologies for high-pressure, long-distance water transfer to support closed-loop recycling systems. |
| Stricter reporting for fugitive emissions (Methane) | Increased EPA and state-level LDAR (Leak Detection and Repair) requirements. Customer focus on reducing their own Scope 1 emissions. | Integrate advanced, low-emission sealing technology into wellhead and pressure control equipment to reduce component-level fugitive emissions. |
Disclaimer
All information, articles, and product details provided on this website are for general informational and educational purposes only. We do not claim any ownership over, nor do we intend to infringe upon, any trademarks, copyrights, logos, brand names, or other intellectual property mentioned or depicted on this site. Such intellectual property remains the property of its respective owners, and any references here are made solely for identification or informational purposes, without implying any affiliation, endorsement, or partnership.
We make no representations or warranties, express or implied, regarding the accuracy, completeness, or suitability of any content or products presented. Nothing on this website should be construed as legal, tax, investment, financial, medical, or other professional advice. In addition, no part of this site—including articles or product references—constitutes a solicitation, recommendation, endorsement, advertisement, or offer to buy or sell any securities, franchises, or other financial instruments, particularly in jurisdictions where such activity would be unlawful.
All content is of a general nature and may not address the specific circumstances of any individual or entity. It is not a substitute for professional advice or services. Any actions you take based on the information provided here are strictly at your own risk. You accept full responsibility for any decisions or outcomes arising from your use of this website and agree to release us from any liability in connection with your use of, or reliance upon, the content or products found herein.