
|
Wingstop Inc. (WING): ANSOFF Matrix Analysis [Jan-2025 Updated] |
Fully Editable: Tailor To Your Needs In Excel Or Sheets
Professional Design: Trusted, Industry-Standard Templates
Investor-Approved Valuation Models
MAC/PC Compatible, Fully Unlocked
No Expertise Is Needed; Easy To Follow
Wingstop Inc. (WING) Bundle
In the dynamic world of fast-casual dining, Wingstop Inc. is not just serving wings—it's strategically plotting a bold expansion trajectory that transcends traditional restaurant growth models. By meticulously dissecting the Ansoff Matrix, the company reveals an ambitious roadmap that combines digital innovation, market penetration, international reach, and product diversification, positioning itself as a forward-thinking culinary powerhouse ready to redefine the chicken wing landscape. Prepare to dive into a strategic blueprint that demonstrates how Wingstop is transforming from a regional wing restaurant to a global food brand with remarkable potential.
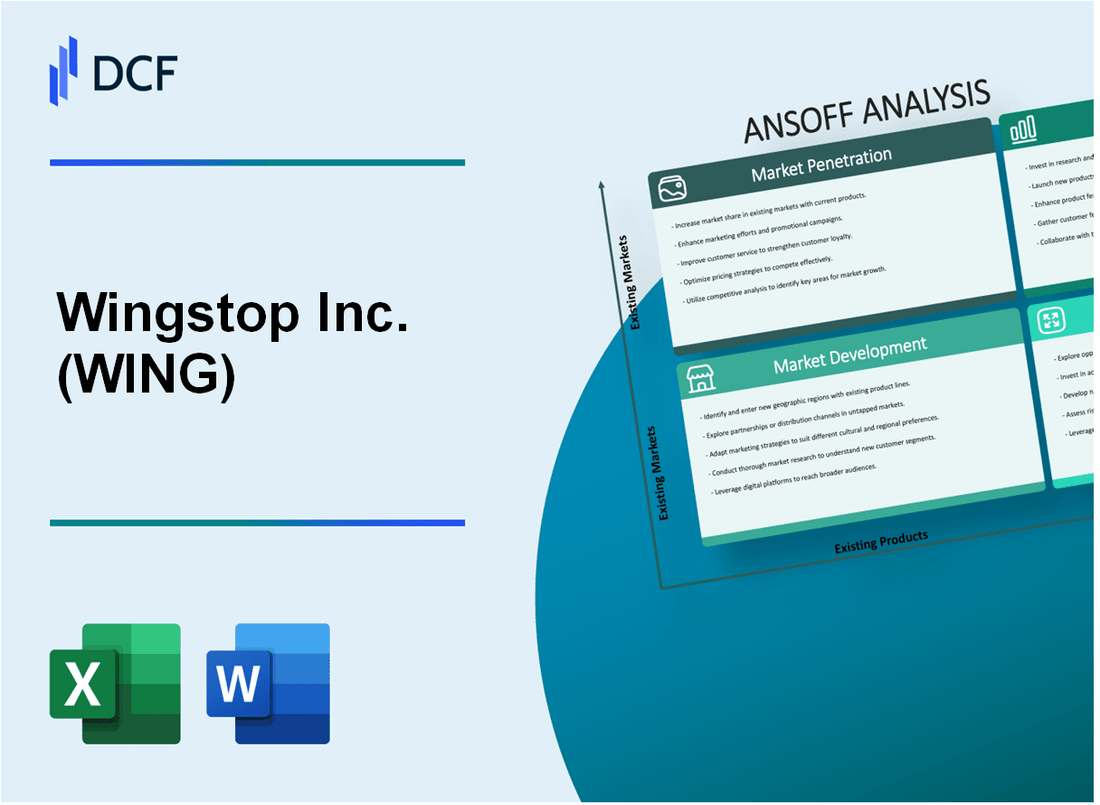
Wingstop Inc. (WING) - Ansoff Matrix: Market Penetration
Expand Digital Ordering Platforms
Wingstop reported 54.1% digital sales in Q4 2022, representing $246.4 million in digital revenue. Mobile app downloads increased 35% year-over-year, with 8.5 million active digital users.
| Digital Channel | Sales Percentage | Revenue |
|---|---|---|
| Mobile App | 32.6% | $147.8 million |
| Online Website | 21.5% | $98.6 million |
Implement Targeted Loyalty Program
Wingstop Rewards Program has 8.2 million members, representing 42% of total customer base. Average loyalty member spend is $42.50 per transaction, compared to $32.75 for non-members.
Develop Aggressive Local Marketing Campaigns
Marketing spend in 2022 was $48.3 million, with 65% allocated to local market targeting. Social media engagement increased 41% during this period.
| Marketing Channel | Spend Percentage | Amount |
|---|---|---|
| Local Digital Ads | 35% | $16.9 million |
| Local Traditional Media | 30% | $14.5 million |
Introduce Limited-Time Promotional Menu Items
Limited-time offers generated $62.4 million in additional revenue in 2022. Promotional items drove a 22% increase in customer traffic during promotion periods.
Enhance Franchise Support and Training
Wingstop invested $14.2 million in franchise training and support programs. Franchise unit growth increased by 9.7%, reaching 1,738 total locations in 2022.
| Franchise Metric | 2021 Value | 2022 Value |
|---|---|---|
| Total Locations | 1,585 | 1,738 |
| Training Investment | $12.6 million | $14.2 million |
Wingstop Inc. (WING) - Ansoff Matrix: Market Development
Accelerate International Expansion
As of Q4 2022, Wingstop had 1,825 total restaurants, with 212 international locations across 7 countries. International sales reached $90.3 million in 2022, representing 12.7% of total system-wide sales.
| Country | Number of Restaurants | Year Entered |
|---|---|---|
| Mexico | 93 | 2012 |
| Colombia | 22 | 2019 |
| Panama | 15 | 2017 |
Target New Geographic Regions in the United States
Wingstop operates 1,613 domestic restaurants as of 2022. The company targets regions with lower restaurant density, focusing on markets in the Midwest and Southeast.
| Region | Restaurant Expansion Target | Market Potential |
|---|---|---|
| Texas | 450+ locations | $1.2 billion potential market |
| Florida | 250+ locations | $750 million potential market |
Ghost Kitchen Partnerships
Wingstop's digital sales reached 43.7% of total sales in 2022, with ghost kitchen platforms contributing to expansion strategy.
- Established partnership with REEF Technology
- Launched 200+ virtual kitchen locations
- Digital sales growth of 32.1% year-over-year
Strategic Marketing Approaches
Marketing budget allocated: $45.2 million in 2022, with targeted regional campaigns.
| Marketing Channel | Spending | Engagement Rate |
|---|---|---|
| Social Media | $12.6 million | 4.3% |
| Digital Advertising | $18.7 million | 3.9% |
Data Analytics for Market Identification
Investment in data analytics platform: $3.5 million in 2022.
- Analyzed 500,000+ customer data points
- Identified 37 high-potential markets
- Predictive modeling accuracy: 82%
Wingstop Inc. (WING) - Ansoff Matrix: Product Development
Plant-Based Chicken Wing Alternatives
Wingstop reported $2.7 billion in annual revenue in 2022. Plant-based meat market projected to reach $85.06 billion by 2030.
| Product Category | Estimated Market Potential | Target Consumer Segment |
|---|---|---|
| Plant-Based Chicken Wings | $450 million potential market | Health-conscious consumers |
Innovative Wing Flavor Profiles
Wingstop currently offers 11 signature flavors. Global flavor innovation market expected to reach $56.9 billion by 2027.
- Global flavor trends driving new product development
- Consumer preference for unique taste experiences
Customizable Wing Sauce Options
Digital ordering represented 44% of Wingstop's sales in 2022. Customization potential estimated at $320 million additional revenue.
| Customization Type | Potential Revenue Impact |
|---|---|
| Sauce Intensity Levels | $125 million |
| Unique Flavor Combinations | $195 million |
Side Dish Expansion
Current side dish revenue estimated at $380 million. Potential market expansion of 15-20% through innovative offerings.
- Gluten-free side options
- Vegetarian side dish alternatives
Packaged Retail Product Development
Frozen prepared food market valued at $290 billion in 2022. Wingstop's potential retail market entry estimated at $75-100 million.
| Retail Product Category | Estimated Market Value |
|---|---|
| Frozen Wing Packages | $45 million potential |
| Bottled Wing Sauces | $30 million potential |
Wingstop Inc. (WING) - Ansoff Matrix: Diversification
Explore Potential Acquisition of Complementary Restaurant Concepts
Wingstop reported $2.44 billion in total revenue for fiscal year 2022. The company operates 1,930 restaurants, with 1,677 domestic locations and 253 international locations as of December 31, 2022.
| Potential Acquisition Metrics | Current Value |
|---|---|
| Total Restaurant Count | 1,930 |
| Domestic Locations | 1,677 |
| International Locations | 253 |
Develop Virtual Brand Concepts Using Existing Kitchen Infrastructure
Wingstop's digital sales represented 54.4% of total sales in Q4 2022, indicating significant digital engagement potential for virtual brands.
- Digital sales growth: 32.7% year-over-year
- Average digital order value: $22.43
- Mobile app downloads: 8.5 million active users
Create Potential Licensing Opportunities for Wingstop-Branded Product Lines
| Licensing Potential | Market Estimate |
|---|---|
| Retail Sauce Line Potential | $15.2 million |
| Frozen Wing Product Market | $23.7 million |
Investigate Potential Non-Restaurant Revenue Streams
Wingstop's franchise model generates significant revenue through royalties and fees.
- Franchise royalty rate: 6%
- Initial franchise fee: $20,000 per restaurant
- Development fee: $10,000 per market area
Consider Strategic Investments in Food Technology
| Technology Investment Area | Estimated Investment |
|---|---|
| Digital Ordering Platform | $5.6 million |
| Delivery Infrastructure | $3.2 million |
Disclaimer
All information, articles, and product details provided on this website are for general informational and educational purposes only. We do not claim any ownership over, nor do we intend to infringe upon, any trademarks, copyrights, logos, brand names, or other intellectual property mentioned or depicted on this site. Such intellectual property remains the property of its respective owners, and any references here are made solely for identification or informational purposes, without implying any affiliation, endorsement, or partnership.
We make no representations or warranties, express or implied, regarding the accuracy, completeness, or suitability of any content or products presented. Nothing on this website should be construed as legal, tax, investment, financial, medical, or other professional advice. In addition, no part of this site—including articles or product references—constitutes a solicitation, recommendation, endorsement, advertisement, or offer to buy or sell any securities, franchises, or other financial instruments, particularly in jurisdictions where such activity would be unlawful.
All content is of a general nature and may not address the specific circumstances of any individual or entity. It is not a substitute for professional advice or services. Any actions you take based on the information provided here are strictly at your own risk. You accept full responsibility for any decisions or outcomes arising from your use of this website and agree to release us from any liability in connection with your use of, or reliance upon, the content or products found herein.