
|
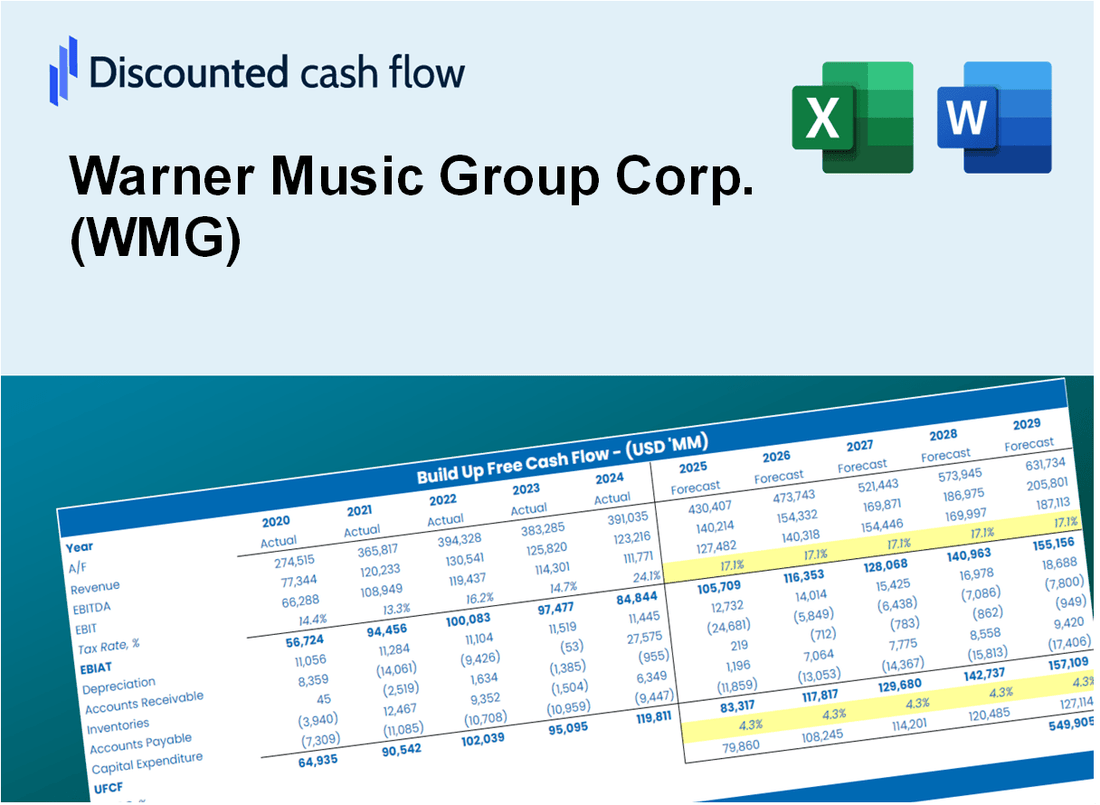
Warner Music Group Corp. (WMG) DCF Valuation |
Fully Editable: Tailor To Your Needs In Excel Or Sheets
Professional Design: Trusted, Industry-Standard Templates
Investor-Approved Valuation Models
MAC/PC Compatible, Fully Unlocked
No Expertise Is Needed; Easy To Follow
Warner Music Group Corp. (WMG) Bundle
Evaluate the financial outlook of Warner Music Group Corp. (WMG) like an expert! This (WMG) DCF Calculator provides pre-filled financial data along with full flexibility to modify revenue growth, WACC, margins, and other crucial assumptions to align with your predictions.
What You Will Get
- Real WMG Financial Data: Pre-filled with Warner Music Group’s historical and projected data for precise analysis.
- Fully Editable Template: Modify key inputs like revenue growth, WACC, and EBITDA % with ease.
- Automatic Calculations: See Warner Music Group’s intrinsic value update instantly based on your changes.
- Professional Valuation Tool: Designed for investors, analysts, and consultants seeking accurate DCF results.
- User-Friendly Design: Simple structure and clear instructions for all experience levels.
Key Features
- Customizable Revenue Inputs: Adjust essential factors such as streaming growth, merchandise sales, and licensing fees.
- Instant DCF Valuation: Quickly computes intrinsic value, NPV, and other financial metrics.
- Industry-Leading Precision: Leverages Warner Music's real-world data for accurate valuation results.
- Effortless Scenario Testing: Evaluate various assumptions and analyze results with ease.
- Efficiency Booster: Avoid the hassle of creating intricate valuation models from the ground up.
How It Works
- Download the Template: Gain immediate access to the Excel-based WMG DCF Calculator.
- Input Your Assumptions: Modify the yellow-highlighted cells for growth rates, WACC, margins, and additional factors.
- Instant Calculations: The model automatically recalculates Warner Music Group’s intrinsic value.
- Test Scenarios: Experiment with various assumptions to assess potential valuation shifts.
- Analyze and Decide: Utilize the outcomes to inform your investment or financial analysis.
Why Choose This Calculator for Warner Music Group Corp. (WMG)?
- Accuracy: Utilizes real Warner Music Group financials to ensure precise data.
- Flexibility: Built to allow users to easily test and adjust inputs as needed.
- Time-Saving: Eliminate the complexity of constructing a DCF model from the ground up.
- Professional-Grade: Created with the expertise and usability expected at the CFO level.
- User-Friendly: Intuitive design makes it accessible for users without extensive financial modeling skills.
Who Should Use Warner Music Group Corp. (WMG)?
- Investors: Gain insights into the music industry with a trusted resource for investment decisions.
- Music Analysts: Utilize comprehensive data to streamline market analysis and reporting.
- Consultants: Effortlessly tailor presentations or reports for clients in the entertainment sector.
- Music Enthusiasts: Enhance your knowledge of the music business and its market dynamics through detailed case studies.
- Educators and Students: Leverage it as a valuable educational resource in music business and finance courses.
What the Template Contains
- Pre-Filled DCF Model: Warner Music Group’s (WMG) financial data preloaded for immediate use.
- WACC Calculator: Detailed calculations for Weighted Average Cost of Capital.
- Financial Ratios: Evaluate Warner Music Group’s (WMG) profitability, leverage, and efficiency.
- Editable Inputs: Change assumptions such as growth, margins, and CAPEX to fit your scenarios.
- Financial Statements: Annual and quarterly reports to support detailed analysis.
- Interactive Dashboard: Easily visualize key valuation metrics and results.
Disclaimer
All information, articles, and product details provided on this website are for general informational and educational purposes only. We do not claim any ownership over, nor do we intend to infringe upon, any trademarks, copyrights, logos, brand names, or other intellectual property mentioned or depicted on this site. Such intellectual property remains the property of its respective owners, and any references here are made solely for identification or informational purposes, without implying any affiliation, endorsement, or partnership.
We make no representations or warranties, express or implied, regarding the accuracy, completeness, or suitability of any content or products presented. Nothing on this website should be construed as legal, tax, investment, financial, medical, or other professional advice. In addition, no part of this site—including articles or product references—constitutes a solicitation, recommendation, endorsement, advertisement, or offer to buy or sell any securities, franchises, or other financial instruments, particularly in jurisdictions where such activity would be unlawful.
All content is of a general nature and may not address the specific circumstances of any individual or entity. It is not a substitute for professional advice or services. Any actions you take based on the information provided here are strictly at your own risk. You accept full responsibility for any decisions or outcomes arising from your use of this website and agree to release us from any liability in connection with your use of, or reliance upon, the content or products found herein.