
|
W&T Offshore, Inc. (WTI) DCF Valuation |
Fully Editable: Tailor To Your Needs In Excel Or Sheets
Professional Design: Trusted, Industry-Standard Templates
Investor-Approved Valuation Models
MAC/PC Compatible, Fully Unlocked
No Expertise Is Needed; Easy To Follow
W&T Offshore, Inc. (WTI) Bundle
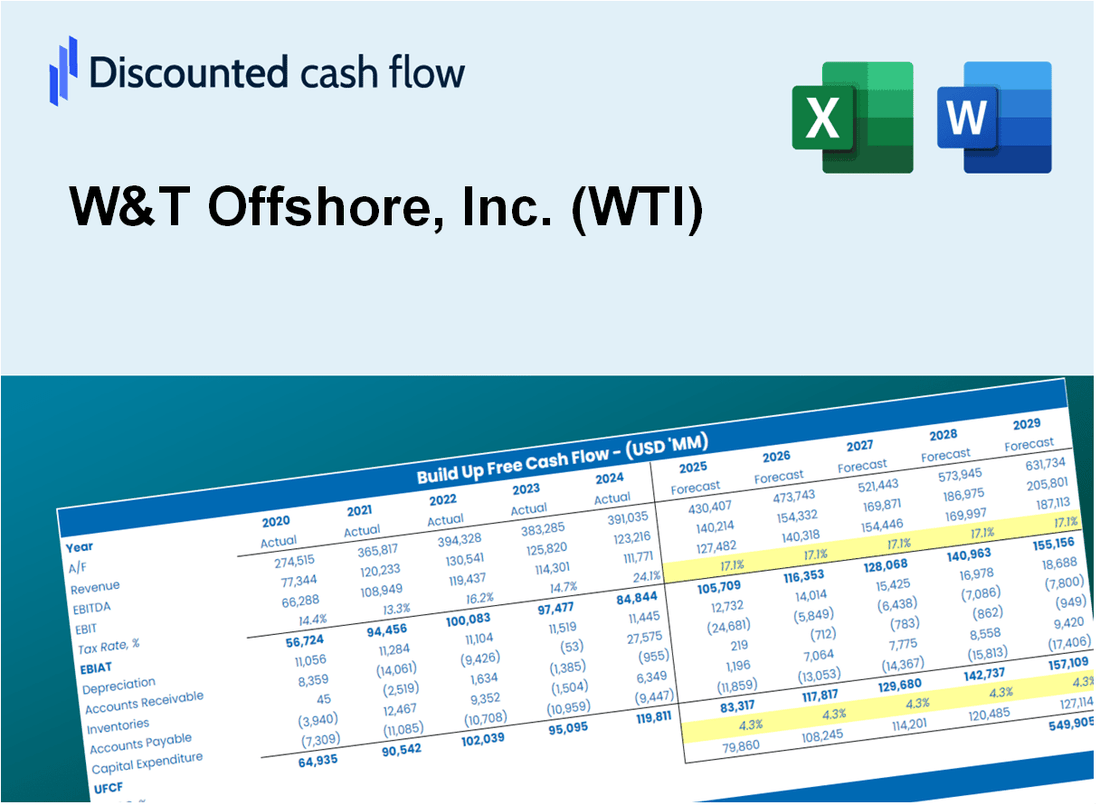
Enhance your investment choices with the W&T Offshore, Inc. (WTI) DCF Calculator! Explore the latest financial data for W&T Offshore, adjust growth projections and expenses, and instantly observe how these alterations affect the intrinsic value of W&T Offshore, Inc. (WTI).
What You Will Get
- Real WTI Financial Data: Pre-filled with W&T Offshore’s historical and projected data for precise analysis.
- Fully Editable Template: Modify key inputs like revenue growth, WACC, and EBITDA % with ease.
- Automatic Calculations: See W&T Offshore’s intrinsic value update instantly based on your changes.
- Professional Valuation Tool: Designed for investors, analysts, and consultants seeking accurate DCF results.
- User-Friendly Design: Simple structure and clear instructions for all experience levels.
Key Features
- Comprehensive DCF Calculator: Features detailed unlevered and levered DCF valuation models tailored for W&T Offshore, Inc. (WTI).
- WACC Calculator: Ready-to-use Weighted Average Cost of Capital sheet with adjustable inputs for precise calculations.
- Customizable Forecast Assumptions: Easily adjust growth rates, capital expenditures, and discount rates to fit your analysis.
- Integrated Financial Ratios: Evaluate profitability, leverage, and efficiency ratios specific to W&T Offshore, Inc. (WTI).
- Interactive Dashboard and Charts: Visual representations highlight essential valuation metrics for straightforward analysis.
How It Works
- Download: Get the pre-prepared Excel file containing W&T Offshore, Inc.'s (WTI) financial data.
- Customize: Modify forecasts such as revenue growth, EBITDA %, and WACC as needed.
- Update Automatically: Watch as intrinsic value and NPV calculations refresh in real-time.
- Test Scenarios: Develop various projections and instantly compare results.
- Make Decisions: Leverage the valuation findings to inform your investment strategy.
Why Choose This Calculator for W&T Offshore, Inc. (WTI)?
- All-in-One Solution: Features DCF, WACC, and financial ratio analyses tailored for W&T Offshore.
- Flexible Inputs: Modify yellow-highlighted cells to explore various financial scenarios.
- In-Depth Analysis: Automatically computes W&T Offshore’s intrinsic value and Net Present Value.
- Ready-to-Use Data: Historical and projected data provide reliable starting points for analysis.
- High-Quality Standards: Perfect for financial analysts, investors, and business consultants focusing on W&T Offshore.
Who Should Use This Product?
- Professional Investors: Develop comprehensive and accurate valuation models for analyzing W&T Offshore, Inc. (WTI) investments.
- Corporate Finance Teams: Evaluate valuation scenarios to inform strategic decisions within their organizations.
- Consultants and Advisors: Deliver precise valuation insights related to W&T Offshore, Inc. (WTI) for their clients.
- Students and Educators: Utilize real-world data to enhance learning and practice in financial modeling.
- Energy Sector Enthusiasts: Gain insights into how companies like W&T Offshore, Inc. (WTI) are valued in the energy market.
What the Template Contains
- Comprehensive DCF Model: Editable template with detailed valuation calculations specifically for W&T Offshore, Inc. (WTI).
- Real-World Data: W&T Offshore’s historical and projected financials preloaded for thorough analysis.
- Customizable Parameters: Adjust WACC, growth rates, and tax assumptions to explore various scenarios.
- Financial Statements: Complete annual and quarterly breakdowns for enhanced insights into W&T Offshore's performance.
- Key Ratios: Integrated analysis for profitability, efficiency, and leverage tailored to W&T Offshore, Inc. (WTI).
- Dashboard with Visual Outputs: Charts and tables designed for clear, actionable results specific to W&T Offshore, Inc. (WTI).
Disclaimer
All information, articles, and product details provided on this website are for general informational and educational purposes only. We do not claim any ownership over, nor do we intend to infringe upon, any trademarks, copyrights, logos, brand names, or other intellectual property mentioned or depicted on this site. Such intellectual property remains the property of its respective owners, and any references here are made solely for identification or informational purposes, without implying any affiliation, endorsement, or partnership.
We make no representations or warranties, express or implied, regarding the accuracy, completeness, or suitability of any content or products presented. Nothing on this website should be construed as legal, tax, investment, financial, medical, or other professional advice. In addition, no part of this site—including articles or product references—constitutes a solicitation, recommendation, endorsement, advertisement, or offer to buy or sell any securities, franchises, or other financial instruments, particularly in jurisdictions where such activity would be unlawful.
All content is of a general nature and may not address the specific circumstances of any individual or entity. It is not a substitute for professional advice or services. Any actions you take based on the information provided here are strictly at your own risk. You accept full responsibility for any decisions or outcomes arising from your use of this website and agree to release us from any liability in connection with your use of, or reliance upon, the content or products found herein.