
|
Weyerhaeuser Company (WY) DCF Valuation |
Fully Editable: Tailor To Your Needs In Excel Or Sheets
Professional Design: Trusted, Industry-Standard Templates
Investor-Approved Valuation Models
MAC/PC Compatible, Fully Unlocked
No Expertise Is Needed; Easy To Follow
Weyerhaeuser Company (WY) Bundle
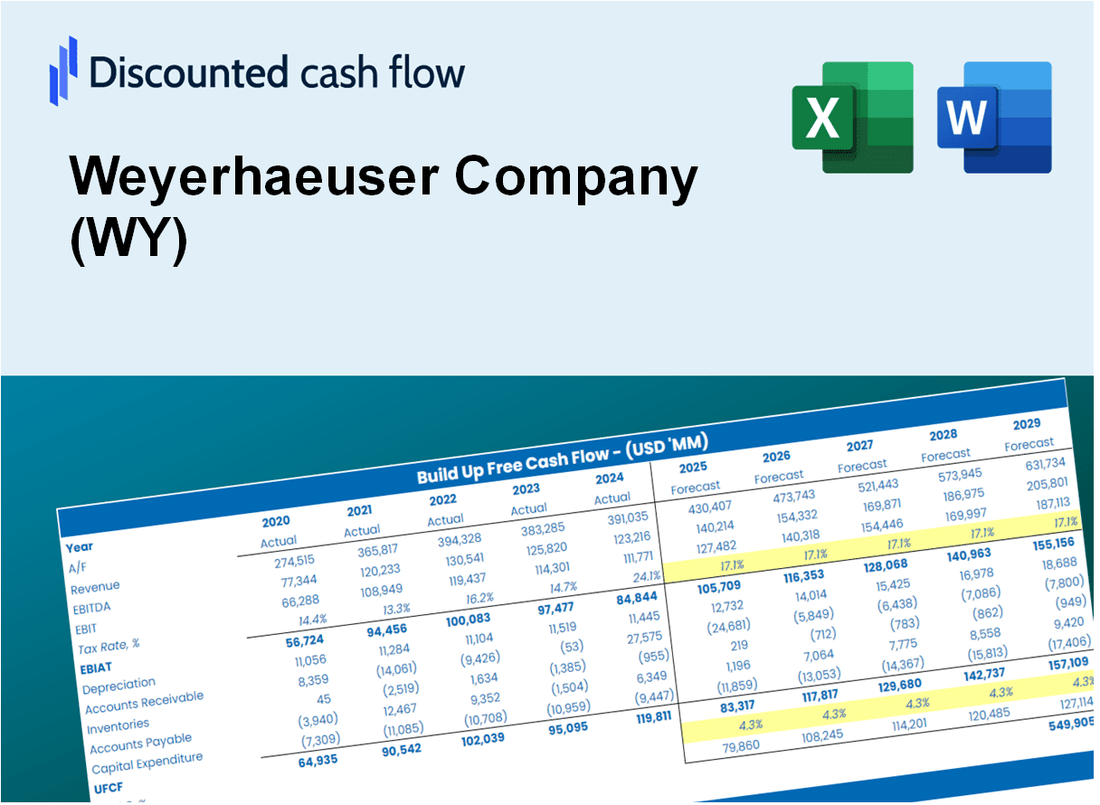
Explore Weyerhaeuser Company's (WY) financial outlook with our user-friendly DCF Calculator! Enter your projections for growth, margins, and expenses to calculate the intrinsic value of Weyerhaeuser Company (WY) and enhance your investment decisions.
Discounted Cash Flow (DCF) - (USD MM)
| Year | AY1 2020 |
AY2 2021 |
AY3 2022 |
AY4 2023 |
AY5 2024 |
FY1 2025 |
FY2 2026 |
FY3 2027 |
FY4 2028 |
FY5 2029 |
|---|---|---|---|---|---|---|---|---|---|---|
| Revenue | 7,532.0 | 10,201.0 | 10,184.0 | 7,674.0 | 7,124.0 | 7,185.5 | 7,247.6 | 7,310.2 | 7,373.4 | 7,437.1 |
| Revenue Growth, % | 0 | 35.44 | -0.16665 | -24.65 | -7.17 | 0.86382 | 0.86382 | 0.86382 | 0.86382 | 0.86382 |
| EBITDA | 1,897.0 | 4,106.0 | 3,055.0 | 1,717.0 | 1,198.0 | 1,934.7 | 1,951.4 | 1,968.3 | 1,985.3 | 2,002.4 |
| EBITDA, % | 25.19 | 40.25 | 30 | 22.37 | 16.82 | 26.93 | 26.93 | 26.93 | 26.93 | 26.93 |
| Depreciation | 472.0 | 477.0 | 480.0 | 500.0 | 502.0 | 419.9 | 423.5 | 427.2 | 430.9 | 434.6 |
| Depreciation, % | 6.27 | 4.68 | 4.71 | 6.52 | 7.05 | 5.84 | 5.84 | 5.84 | 5.84 | 5.84 |
| EBIT | 1,425.0 | 3,629.0 | 2,575.0 | 1,217.0 | 696.0 | 1,514.8 | 1,527.9 | 1,541.1 | 1,554.4 | 1,567.8 |
| EBIT, % | 18.92 | 35.57 | 25.28 | 15.86 | 9.77 | 21.08 | 21.08 | 21.08 | 21.08 | 21.08 |
| Total Cash | 495.0 | 1,879.0 | 1,581.0 | 1,164.0 | 684.0 | 938.2 | 946.3 | 954.5 | 962.7 | 971.1 |
| Total Cash, percent | .0 | .0 | .0 | .0 | .0 | .0 | .0 | .0 | .0 | .0 |
| Account Receivables | 532.0 | 531.0 | 399.0 | 364.0 | 315.0 | 364.3 | 367.5 | 370.6 | 373.9 | 377.1 |
| Account Receivables, % | 7.06 | 5.21 | 3.92 | 4.74 | 4.42 | 5.07 | 5.07 | 5.07 | 5.07 | 5.07 |
| Inventories | 443.0 | 520.0 | 550.0 | 566.0 | 607.0 | 463.8 | 467.8 | 471.9 | 476.0 | 480.1 |
| Inventories, % | 5.88 | 5.1 | 5.4 | 7.38 | 8.52 | 6.46 | 6.46 | 6.46 | 6.46 | 6.46 |
| Accounts Payable | 204.0 | 281.0 | 247.0 | 287.0 | 255.0 | 218.6 | 220.4 | 222.3 | 224.3 | 226.2 |
| Accounts Payable, % | 2.71 | 2.75 | 2.43 | 3.74 | 3.58 | 3.04 | 3.04 | 3.04 | 3.04 | 3.04 |
| Capital Expenditure | -706.0 | -590.0 | -763.0 | -680.0 | -667.0 | -587.4 | -592.5 | -597.6 | -602.7 | -607.9 |
| Capital Expenditure, % | -9.37 | -5.78 | -7.49 | -8.86 | -9.36 | -8.17 | -8.17 | -8.17 | -8.17 | -8.17 |
| Tax Rate, % | 7.26 | 7.26 | 7.26 | 7.26 | 7.26 | 7.26 | 7.26 | 7.26 | 7.26 | 7.26 |
| EBITAT | 1,156.5 | 2,853.1 | 2,100.2 | 1,089.7 | 645.5 | 1,283.4 | 1,294.5 | 1,305.7 | 1,317.0 | 1,328.3 |
| Depreciation | ||||||||||
| Changes in Account Receivables | ||||||||||
| Changes in Inventories | ||||||||||
| Changes in Accounts Payable | ||||||||||
| Capital Expenditure | ||||||||||
| UFCF | 151.5 | 2,741.1 | 1,885.2 | 968.7 | 456.5 | 1,173.3 | 1,120.3 | 1,130.0 | 1,139.7 | 1,149.6 |
| WACC, % | 7.62 | 7.59 | 7.62 | 7.72 | 7.76 | 7.66 | 7.66 | 7.66 | 7.66 | 7.66 |
| PV UFCF | ||||||||||
| SUM PV UFCF | 4,605.2 | |||||||||
| Long Term Growth Rate, % | 3.00 | |||||||||
| Free cash flow (T + 1) | 1,184 | |||||||||
| Terminal Value | 25,415 | |||||||||
| Present Terminal Value | 17,573 | |||||||||
| Enterprise Value | 22,178 | |||||||||
| Net Debt | 4,421 | |||||||||
| Equity Value | 17,757 | |||||||||
| Diluted Shares Outstanding, MM | 729 | |||||||||
| Equity Value Per Share | 24.36 |
What You Will Get
- Authentic WY Financials: Provides historical and projected data for precise valuation.
- Customizable Inputs: Adjust WACC, tax rates, revenue growth, and capital expenditures as needed.
- Real-Time Calculations: Intrinsic value and NPV are computed automatically.
- Scenario Analysis: Evaluate various scenarios to assess Weyerhaeuser's future performance.
- User-Friendly Design: Designed for industry professionals while remaining accessible for newcomers.
Key Features
- Customizable Timber Metrics: Adjust essential factors like lumber prices, production volume, and operating costs.
- Instant DCF Valuation: Quickly determines intrinsic value, NPV, and other financial outputs.
- Industry-Leading Precision: Incorporates Weyerhaeuser’s actual financial data for accurate valuation results.
- Effortless Scenario Analysis: Evaluate various assumptions and assess outcomes with ease.
- Efficiency Booster: Remove the hassle of constructing intricate valuation models from the ground up.
How It Works
- Download: Obtain the pre-configured Excel file featuring Weyerhaeuser Company's (WY) financial data.
- Customize: Modify projections such as revenue growth, EBITDA %, and WACC to fit your analysis.
- Update Automatically: Watch as intrinsic value and NPV calculations refresh in real-time.
- Test Scenarios: Generate various forecasts and instantly compare the results.
- Make Decisions: Leverage the valuation insights to inform your investment choices.
Why Choose Weyerhaeuser Company (WY)?
- Save Time: Access ready-to-use resources without the hassle of starting from scratch.
- Enhance Accuracy: Dependable data and methodologies minimize errors in your assessments.
- Fully Customizable: Adjust models to align with your specific assumptions and forecasts.
- Easy to Understand: Intuitive visuals and outputs simplify the analysis of results.
- Trusted by Professionals: Crafted for those who prioritize precision and functionality.
Who Should Use Weyerhaeuser Company (WY)?
- Investors: Gain insights into sustainable forestry practices and long-term growth potential.
- Environmental Analysts: Access data on Weyerhaeuser's commitment to responsible land management and conservation.
- Consultants: Utilize the company's performance metrics for strategic planning and client advisories.
- Industry Enthusiasts: Explore innovative timber products and their impact on the market.
- Educators and Students: Employ case studies from Weyerhaeuser in environmental science and business courses.
What the Template Contains
- Historical Data: Includes Weyerhaeuser Company’s (WY) past financials and baseline forecasts.
- DCF and Levered DCF Models: Detailed templates to calculate Weyerhaeuser Company’s (WY) intrinsic value.
- WACC Sheet: Pre-built calculations for Weighted Average Cost of Capital.
- Editable Inputs: Modify key drivers like growth rates, EBITDA %, and CAPEX assumptions.
- Quarterly and Annual Statements: A complete breakdown of Weyerhaeuser Company’s (WY) financials.
- Interactive Dashboard: Visualize valuation results and projections dynamically.
Disclaimer
All information, articles, and product details provided on this website are for general informational and educational purposes only. We do not claim any ownership over, nor do we intend to infringe upon, any trademarks, copyrights, logos, brand names, or other intellectual property mentioned or depicted on this site. Such intellectual property remains the property of its respective owners, and any references here are made solely for identification or informational purposes, without implying any affiliation, endorsement, or partnership.
We make no representations or warranties, express or implied, regarding the accuracy, completeness, or suitability of any content or products presented. Nothing on this website should be construed as legal, tax, investment, financial, medical, or other professional advice. In addition, no part of this site—including articles or product references—constitutes a solicitation, recommendation, endorsement, advertisement, or offer to buy or sell any securities, franchises, or other financial instruments, particularly in jurisdictions where such activity would be unlawful.
All content is of a general nature and may not address the specific circumstances of any individual or entity. It is not a substitute for professional advice or services. Any actions you take based on the information provided here are strictly at your own risk. You accept full responsibility for any decisions or outcomes arising from your use of this website and agree to release us from any liability in connection with your use of, or reliance upon, the content or products found herein.