
|
Xenetic Biosciences, Inc. (XBIO) DCF Valuation |
Fully Editable: Tailor To Your Needs In Excel Or Sheets
Professional Design: Trusted, Industry-Standard Templates
Investor-Approved Valuation Models
MAC/PC Compatible, Fully Unlocked
No Expertise Is Needed; Easy To Follow
Xenetic Biosciences, Inc. (XBIO) Bundle
Looking to evaluate the intrinsic value of Xenetic Biosciences, Inc.? Our (XBIO) DCF Calculator integrates real-world data with comprehensive customization features, allowing you to adjust forecasts and enhance your investment strategies.
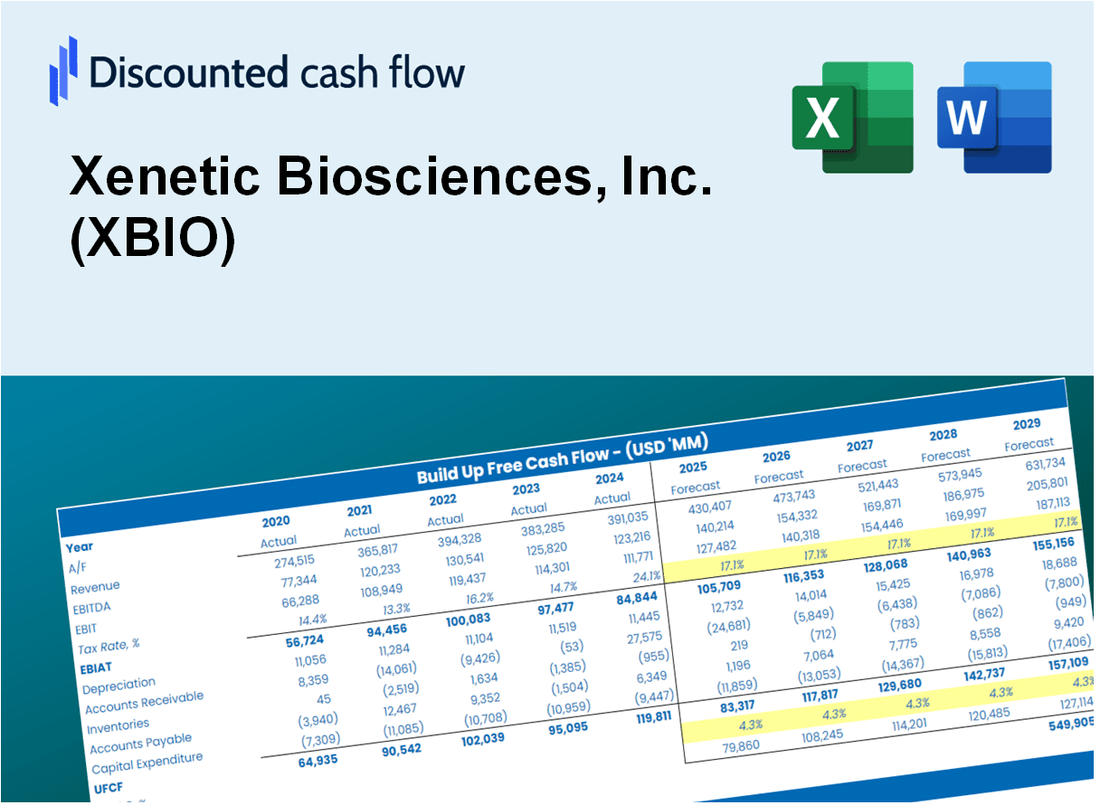
Discounted Cash Flow (DCF) - (USD MM)
| Year | AY1 2020 |
AY2 2021 |
AY3 2022 |
AY4 2023 |
AY5 2024 |
FY1 2025 |
FY2 2026 |
FY3 2027 |
FY4 2028 |
FY5 2029 |
|---|---|---|---|---|---|---|---|---|---|---|
| Revenue | .4 | 1.2 | 1.7 | 2.5 | 2.5 | 3.7 | 5.5 | 8.2 | 12.2 | 18.1 |
| Revenue Growth, % | 0 | 165.64 | 47.06 | 48.8 | -1.56 | 48.58 | 48.58 | 48.58 | 48.58 | 48.58 |
| EBITDA | -4.7 | -5.7 | -6.7 | -4.5 | -4.2 | -3.7 | -5.5 | -8.2 | -12.2 | -18.1 |
| EBITDA, % | -1074.23 | -492.06 | -393.57 | -177.8 | -168.16 | -100 | -100 | -100 | -100 | -100 |
| Depreciation | .0 | .0 | .0 | .0 | .2 | .1 | .2 | .3 | .4 | .6 |
| Depreciation, % | 6.6 | 3.06 | 1.58 | -1.11 | 6.13 | 3.25 | 3.25 | 3.25 | 3.25 | 3.25 |
| EBIT | -4.7 | -5.7 | -6.7 | -4.5 | -4.4 | -3.7 | -5.5 | -8.2 | -12.2 | -18.1 |
| EBIT, % | -1080.83 | -495.12 | -395.15 | -176.69 | -174.29 | -100 | -100 | -100 | -100 | -100 |
| Total Cash | 11.5 | 18.2 | 13.1 | 9.0 | 6.2 | 3.7 | 5.5 | 8.2 | 12.2 | 18.1 |
| Total Cash, percent | .0 | .0 | .0 | .0 | .0 | .0 | .0 | .0 | .0 | .0 |
| Account Receivables | .0 | .0 | .0 | .0 | .0 | .0 | .0 | .0 | .0 | .0 |
| Account Receivables, % | 0 | 0 | 0 | 0 | 0 | 0 | 0 | 0 | 0 | 0 |
| Inventories | .0 | .0 | .0 | .0 | .0 | .0 | .0 | .0 | .0 | .0 |
| Inventories, % | 0 | 0 | 0 | 0 | 0 | 0 | 0 | 0 | 0 | 0 |
| Accounts Payable | .3 | .4 | .3 | .2 | .3 | 1.1 | 1.6 | 2.4 | 3.5 | 5.2 |
| Accounts Payable, % | 74.93 | 31.23 | 16.83 | 9.48 | 11.34 | 28.76 | 28.76 | 28.76 | 28.76 | 28.76 |
| Capital Expenditure | .0 | .0 | -.5 | .0 | .0 | -.2 | -.3 | -.5 | -.7 | -1.1 |
| Capital Expenditure, % | 0 | 0 | -29.29 | 0 | 0 | -5.86 | -5.86 | -5.86 | -5.86 | -5.86 |
| Tax Rate, % | 0 | 0 | 0 | 0 | 0 | 0 | 0 | 0 | 0 | 0 |
| EBITAT | -3.7 | -5.6 | -6.6 | -4.5 | -4.4 | -3.5 | -5.2 | -7.8 | -11.6 | -17.2 |
| Depreciation | ||||||||||
| Changes in Account Receivables | ||||||||||
| Changes in Inventories | ||||||||||
| Changes in Accounts Payable | ||||||||||
| Capital Expenditure | ||||||||||
| UFCF | -3.4 | -5.6 | -7.1 | -4.6 | -4.2 | -2.8 | -4.9 | -7.2 | -10.7 | -16.0 |
| WACC, % | 15.1 | 15.1 | 15.1 | 15.1 | 15.1 | 15.1 | 15.1 | 15.1 | 15.1 | 15.1 |
| PV UFCF | ||||||||||
| SUM PV UFCF | -24.9 | |||||||||
| Long Term Growth Rate, % | 2.00 | |||||||||
| Free cash flow (T + 1) | -16 | |||||||||
| Terminal Value | -124 | |||||||||
| Present Terminal Value | -61 | |||||||||
| Enterprise Value | -86 | |||||||||
| Net Debt | -6 | |||||||||
| Equity Value | -80 | |||||||||
| Diluted Shares Outstanding, MM | 2 | |||||||||
| Equity Value Per Share | -52.05 |
What You Will Get
- Real Xenetic Data: Preloaded financials – from revenue to EBIT – based on actual and projected figures for Xenetic Biosciences, Inc. (XBIO).
- Full Customization: Adjust all critical parameters (yellow cells) like WACC, growth %, and tax rates specific to (XBIO).
- Instant Valuation Updates: Automatic recalculations to analyze the impact of changes on Xenetic's fair value.
- Versatile Excel Template: Tailored for quick edits, scenario testing, and detailed projections relevant to (XBIO).
- Time-Saving and Accurate: Skip building models from scratch while maintaining precision and flexibility for (XBIO).
Key Features
- Comprehensive Data Access: Xenetic Biosciences' historical financial records and pre-filled projections.
- Customizable Parameters: Modify WACC, tax rates, revenue growth, and EBITDA margins as needed.
- Real-Time Insights: Observe the intrinsic value of Xenetic Biosciences recalculating instantly.
- Intuitive Visual Displays: Dashboard graphs illustrate valuation outcomes and essential metrics.
- Designed for Precision: A reliable resource for analysts, investors, and finance professionals.
How It Works
- 1. Download the Model: Obtain and open the Excel template featuring Xenetic Biosciences, Inc.'s (XBIO) financial data.
- 2. Adjust Key Inputs: Modify essential variables such as revenue growth, discount rates, and investment expenditures.
- 3. Analyze Results Immediately: The DCF model automatically computes the intrinsic value and net present value (NPV).
- 4. Explore Different Scenarios: Evaluate various projections to understand a range of valuation possibilities.
- 5. Present with Assurance: Share professional valuation analyses to enhance your strategic decisions.
Why Choose Xenetic Biosciences, Inc. (XBIO)?
- Innovative Solutions: Pioneering advanced drug delivery technologies to enhance therapeutic outcomes.
- Proven Expertise: A dedicated team with extensive experience in biopharmaceutical development.
- Robust Pipeline: A diverse range of products in various stages of development to meet market needs.
- Commitment to Quality: Adherence to the highest standards in research and manufacturing processes.
- Collaborative Partnerships: Strong alliances with industry leaders to drive innovation and growth.
Who Should Use This Product?
- Biotechnology Students: Understand drug development processes and apply them to real-world case studies.
- Researchers: Utilize advanced models to enhance your studies in biotech innovations.
- Investors: Evaluate your investment strategies and analyze valuation metrics for Xenetic Biosciences, Inc. (XBIO).
- Market Analysts: Optimize your analysis with a comprehensive, adaptable financial model tailored for biotech firms.
- Entrepreneurs: Learn from the strategies used by established biotech companies like Xenetic Biosciences, Inc. (XBIO).
What the Template Contains
- Operating and Balance Sheet Data: Pre-filled Xenetic Biosciences historical data and forecasts, including revenue, EBITDA, EBIT, and capital expenditures.
- WACC Calculation: A dedicated sheet for Weighted Average Cost of Capital (WACC), featuring parameters such as Beta, risk-free rate, and share price.
- DCF Valuation (Unlevered and Levered): Editable Discounted Cash Flow models that illustrate intrinsic value with comprehensive calculations.
- Financial Statements: Pre-loaded financial statements (annual and quarterly) to facilitate thorough analysis.
- Key Ratios: Includes profitability, leverage, and efficiency ratios for Xenetic Biosciences, Inc. (XBIO).
- Dashboard and Charts: Visual summary of valuation outputs and assumptions for easy result analysis.
Disclaimer
All information, articles, and product details provided on this website are for general informational and educational purposes only. We do not claim any ownership over, nor do we intend to infringe upon, any trademarks, copyrights, logos, brand names, or other intellectual property mentioned or depicted on this site. Such intellectual property remains the property of its respective owners, and any references here are made solely for identification or informational purposes, without implying any affiliation, endorsement, or partnership.
We make no representations or warranties, express or implied, regarding the accuracy, completeness, or suitability of any content or products presented. Nothing on this website should be construed as legal, tax, investment, financial, medical, or other professional advice. In addition, no part of this site—including articles or product references—constitutes a solicitation, recommendation, endorsement, advertisement, or offer to buy or sell any securities, franchises, or other financial instruments, particularly in jurisdictions where such activity would be unlawful.
All content is of a general nature and may not address the specific circumstances of any individual or entity. It is not a substitute for professional advice or services. Any actions you take based on the information provided here are strictly at your own risk. You accept full responsibility for any decisions or outcomes arising from your use of this website and agree to release us from any liability in connection with your use of, or reliance upon, the content or products found herein.