
|
22nd Century Group, Inc. (XXII) DCF Valuation |
Fully Editable: Tailor To Your Needs In Excel Or Sheets
Professional Design: Trusted, Industry-Standard Templates
Investor-Approved Valuation Models
MAC/PC Compatible, Fully Unlocked
No Expertise Is Needed; Easy To Follow
22nd Century Group, Inc. (XXII) Bundle
Looking to determine the intrinsic value of 22nd Century Group, Inc.? Our XXII DCF Calculator integrates real-world data with comprehensive customization features, enabling you to adjust forecasts and enhance your investment strategies.
What You Will Get
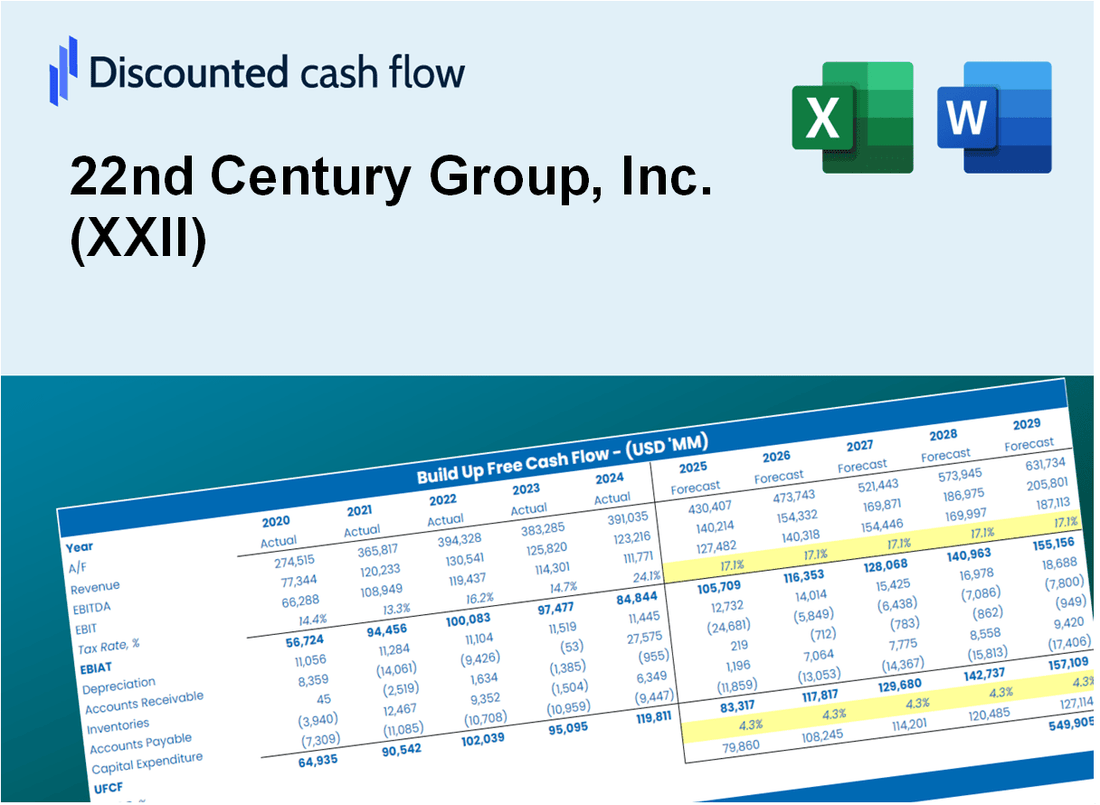
- Real 22nd Century Group Data: Preloaded financial metrics – from revenue to EBIT – based on actual and projected figures.
- Full Customization: Modify all essential parameters (yellow cells) such as WACC, growth %, and tax rates.
- Instant Valuation Updates: Automatic recalculations to assess the impact of changes on 22nd Century Group’s fair value.
- Versatile Excel Template: Designed for quick edits, scenario testing, and comprehensive projections.
- Time-Saving and Accurate: Avoid building models from the ground up while ensuring precision and flexibility.
Key Features
- Comprehensive DCF Calculator: Features detailed unlevered and levered DCF valuation models tailored for 22nd Century Group, Inc. (XXII).
- WACC Calculator: Pre-designed Weighted Average Cost of Capital sheet with adjustable inputs for precise calculations.
- Customizable Forecast Assumptions: Easily modify growth rates, capital expenditures, and discount rates to fit your analysis.
- Integrated Financial Ratios: Evaluate profitability, leverage, and efficiency ratios specifically for 22nd Century Group, Inc. (XXII).
- Interactive Dashboard and Charts: Visual representations summarize essential valuation metrics for straightforward analysis.
How It Works
- Download the Template: Gain immediate access to the Excel-based XXII DCF Calculator.
- Input Your Assumptions: Modify the yellow-highlighted cells for growth rates, WACC, margins, and more.
- Instant Calculations: The model automatically recalculates the intrinsic value of 22nd Century Group, Inc.
- Test Scenarios: Experiment with various assumptions to assess potential changes in valuation.
- Analyze and Decide: Utilize the results to inform your investment or financial strategy.
Why Choose This Calculator for 22nd Century Group, Inc. (XXII)?
- Accurate Data: Up-to-date financial information for 22nd Century Group ensures dependable valuation outcomes.
- Customizable: Tailor essential parameters such as growth rates, WACC, and tax rates to align with your forecasts.
- Time-Saving: Pre-configured calculations save you the hassle of building from the ground up.
- Professional-Grade Tool: Crafted for investors, analysts, and consultants focused on 22nd Century Group.
- User-Friendly: Easy-to-navigate layout and clear, step-by-step guidance cater to users of all experience levels.
Who Should Use This Product?
- Investors: Evaluate the potential of 22nd Century Group, Inc. (XXII) through detailed financial analysis.
- Students: Explore the intricacies of the biotech sector and learn about regulatory impacts on company valuations.
- Researchers: Utilize data from 22nd Century Group, Inc. (XXII) for studies on tobacco harm reduction and cannabis innovations.
- Analysts: Enhance your analysis with a robust financial model tailored for the unique aspects of the biotech industry.
- Entrepreneurs: Discover strategies used by established companies like 22nd Century Group, Inc. (XXII) to navigate market challenges.
What the Template Contains
- Preloaded XXII Data: Historical and projected financial data, including revenue, EBIT, and capital expenditures.
- DCF and WACC Models: Professional-grade sheets for calculating intrinsic value and Weighted Average Cost of Capital.
- Editable Inputs: Yellow-highlighted cells for adjusting revenue growth, tax rates, and discount rates.
- Financial Statements: Comprehensive annual and quarterly financials for deeper analysis.
- Key Ratios: Profitability, leverage, and efficiency ratios to evaluate performance.
- Dashboard and Charts: Visual summaries of valuation outcomes and assumptions.
Disclaimer
All information, articles, and product details provided on this website are for general informational and educational purposes only. We do not claim any ownership over, nor do we intend to infringe upon, any trademarks, copyrights, logos, brand names, or other intellectual property mentioned or depicted on this site. Such intellectual property remains the property of its respective owners, and any references here are made solely for identification or informational purposes, without implying any affiliation, endorsement, or partnership.
We make no representations or warranties, express or implied, regarding the accuracy, completeness, or suitability of any content or products presented. Nothing on this website should be construed as legal, tax, investment, financial, medical, or other professional advice. In addition, no part of this site—including articles or product references—constitutes a solicitation, recommendation, endorsement, advertisement, or offer to buy or sell any securities, franchises, or other financial instruments, particularly in jurisdictions where such activity would be unlawful.
All content is of a general nature and may not address the specific circumstances of any individual or entity. It is not a substitute for professional advice or services. Any actions you take based on the information provided here are strictly at your own risk. You accept full responsibility for any decisions or outcomes arising from your use of this website and agree to release us from any liability in connection with your use of, or reliance upon, the content or products found herein.