|
YETI Holdings, Inc. (YETI): BCG Matrix [Dec-2025 Updated] |
Fully Editable: Tailor To Your Needs In Excel Or Sheets
Professional Design: Trusted, Industry-Standard Templates
Investor-Approved Valuation Models
MAC/PC Compatible, Fully Unlocked
No Expertise Is Needed; Easy To Follow
YETI Holdings, Inc. (YETI) Bundle
As a seasoned financial analyst, I see YETI Holdings, Inc. in a classic portfolio pivot as of late 2025: the reliable Drinkware Cash Cow, making up approximately 57% of sales, is funding aggressive Stars like 14% international growth and new product bets. Still, the real story is the high-stakes funding of Question Marks-new markets like Japan and hydration lines-which requires a close look at how the company is managing the 4% softness in its core segment while investing for the future. Dive in to see the full breakdown of where YETI is winning, where it's spending, and where it might be lagging.
Background of YETI Holdings, Inc. (YETI)
You're looking at YETI Holdings, Inc. (YETI), a company that built its reputation on making premium, durable gear for the outdoor lifestyle market. Founded back in 2006 by brothers Roy and Ryan Seiders, the whole idea started because they wanted better coolers that could actually handle tough adventures. That foundational commitment to rugged quality is still central to the YETI brand today.
YETI Holdings, Inc. designs, markets, and distributes these high-performance products through both wholesale channels and its own direct-to-consumer (DTC) operations. As of the last full-year snapshot in 2024, the product portfolio was clearly segmented: Drinkware made up the largest piece at 60% of net sales, followed by Coolers & Equipment at 38%, with Other categories like apparel making up the remaining 2%.
Looking at the most recent performance data from the third quarter of 2025, things showed a mixed picture. Total net sales ticked up 2% year-over-year to $487.8 million. That modest overall growth was really powered by international markets, which surged 14%, helping to offset a 1% sales decline in the U.S. business. Honestly, the growth engine in Q3 was the Coolers & Equipment segment, which saw net sales jump 12% to $215 million.
However, the Drinkware category faced headwinds, with sales declining 4% to $264 million in that same quarter. This divergence is important; it shows where the current market strength lies for YETI. On the channel front, DTC sales grew 3% to $289 million, showing progress in their omni-channel transformation, while Wholesale sales saw a slight 1% increase to $199 million.
For the full fiscal year 2025, management has guided for adjusted net sales growth to land between 1% and 2%, a slight moderation from earlier expectations, partly due to supply chain shifts. You should note that the company is actively navigating tariff pressures, which have been a drag on margins. A core strategic action for 2025 is accelerating supply chain transformation, with a specific goal to move 50% of global drinkware capacity out of China by the end of the year. They are also planning a record number of product introductions, with over 30 new products slated for 2025.
YETI Holdings, Inc. (YETI) - BCG Matrix: Stars
You're looking at the engine room of YETI Holdings, Inc.'s current growth, the segment where high market share meets a rapidly expanding market. These are the businesses that demand heavy investment to maintain their lead, but they are the ones that will become the reliable Cash Cows when the market matures.
Coolers & Equipment: Strong Q3 2025 growth at 12%, driven by hard coolers and bags, indicating high market share in a growing premium segment.
The Coolers & Equipment category was the standout performer in the third quarter of 2025. Net sales for this segment hit $215.0 million, marking a 12% year-over-year increase. This performance shows YETI Holdings, Inc. is successfully capturing share in the premium hard cooler and equipment space, even as the overall U.S. business saw a 1% sales decline. This category is definitely where the brand's core strength is translating directly into top-line gains.
| Star Category | Q3 2025 Net Sales (Millions USD) | Q3 2025 YoY Growth Rate |
| Coolers & Equipment | 215.0 | 12% |
| International Sales | 100.4 | 14% |
International Sales: Robust Q3 2025 growth of 14% in markets like Europe and Australia, showing high growth potential.
International markets are showing the high-growth trajectory we want to see in a Star. In Q3 2025, international net sales grew by 14%. These sales reached $100.4 million, which means this segment now accounts for 21% of the company's total net sales. Management projects this international business to grow between 15% and 20% for the full fiscal year 2025. That's substantial expansion potential, especially with early traction noted in Japan.
Bags and Backpacks: A key driver within the Coolers & Equipment category, with strong demand and high growth, diversifying the core product line.
Within that strong Coolers & Equipment performance, Bags and Backpacks are pulling significant weight. This sub-category is crucial because it diversifies revenue away from the more challenged Drinkware segment. You see strong demand here, which supports the overall 12% category growth. It helps build out the lifestyle aspect of the brand.
- Strong momentum noted in bags and packs.
- Diversifies revenue base within the premium segment.
- Supports the high growth of the Coolers & Equipment category.
New Product Innovation: The launch of over 30 new products in 2025, including extensions like the Silo Jug, which are expected to drive future high-growth revenue.
The investment into the innovation pipeline is aggressive, which is exactly what you do with a Star. YETI Holdings, Inc. is on track to launch over 30 new products in fiscal 2025, up from 24 in 2024. This pipeline includes specific extensions like the YETI Shaker Bottle and other items like insulated sports jugs and new backpack releases. Keeping this pace is key; if they maintain this success until the high-growth international markets slow, these products will transition into the next generation of Cash Cows.
- Planned launches for 2025: Over 30.
- Launches in 2024 for comparison: 24.
- Innovation is expected to deliver compounding growth.
YETI Holdings, Inc. (YETI) - BCG Matrix: Cash Cows
Cash Cows for YETI Holdings, Inc. (YETI) are characterized by high market share in mature segments, which generates substantial, stable cash flow to fund other areas of the business. These are the products that are leaders, consuming minimal investment for maintenance while providing the necessary capital.
The Drinkware category, particularly in the U.S. market, fits this profile. This segment historically accounted for approximately 57% of Q3 2024 sales, indicating a dominant position in a mature product category. Despite its maturity, the segment still delivered Q3 2025 sales of $263.8 million, representing about 54.1% of the total Q3 2025 net sales of $487.8 million. This segment faced headwinds, with Drinkware sales declining 4% year-over-year for the third quarter of 2025, reflecting the mature, promotional nature of the U.S. market.
The Direct-to-Consumer (DTC) Channel is another critical Cash Cow component, acting as a high-margin engine. By Q3 2025, the DTC channel represented 60% of YETI Holdings, Inc.'s trailing twelve-month revenue, which totaled $1.84 billion. This channel generated $288.7 million in net sales for Q3 2025, a 3% increase year-over-year.
The Core Rambler Tumbler Line within Drinkware maintains a dominant market share in the premium insulated drinkware space, ensuring consistent, high-volume sales even when the overall segment contracts. The stability of this core offering is what allows the company to maintain the Cash Cow status for the broader category.
The financial output from these mature, market-leading assets is significant. Free Cash Flow generation is projected to be approximately $200 million for the full fiscal year 2025. This cash is vital for funding the Stars and Question Marks, covering corporate overhead, and supporting capital returns to shareholders.
Here is a snapshot of the key financial metrics supporting the Cash Cow classification as of the third quarter of 2025:
| Metric | Value/Percentage | Period/Context |
| Drinkware Revenue Contribution (Q3 2025) | $263.8 million | Q3 2025 |
| Drinkware Sales YoY Change | -4% | Q3 2025 |
| DTC Channel Revenue Share (TTM) | 60% | By Q3 2025 |
| DTC Channel Sales | $288.7 million | Q3 2025 |
| Projected Full Year Free Cash Flow | Approximately $200 million | Fiscal Year 2025 |
| Total Net Sales | $487.8 million | Q3 2025 |
The operational focus for these segments is on efficiency and maintenance, not aggressive growth spending. You can see the investment profile reflected in the strategy:
- Investments focus on infrastructure to improve efficiency and increase cash flow.
- Promotion and placement spending is kept low relative to Stars.
- The company increased its 2025 share repurchase target to $300 million, a direct use of Cash Cow generated funds.
- Capital expenditures for 2025 are projected at approximately $50 million, a relatively modest figure supporting existing infrastructure.
YETI Holdings, Inc. (YETI) - BCG Matrix: Dogs
Dogs, are units or products with a low market share and low growth rates. They frequently break even, neither earning nor consuming much cash. Dogs are generally considered cash traps because businesses have money tied up in them, even though they bring back almost nothing in return. These business units are prime candidates for divestiture.
DOGS (low growth products (brands), low market share): Dogs are in low growth markets and have low market share. Dogs should be avoided and minimized. Expensive turn-around plans usually do not help.
The following table summarizes the financial context for YETI Holdings, Inc. in Fiscal Year 2024, against which the Dog category is assessed:
| Metric | Value (FY 2024) |
| Total Net Sales | $1,829.9 million |
| Coolers & Equipment Net Sales Share | 38% |
| Drinkware Net Sales Share | 60% |
| Other Category Net Sales Share | 2% |
Older/Niche Accessories and Apparel: The 'Other' category is small, representing only 2% of 2024 net sales, with low market share and minimal impact on overall growth. For context, this category generated revenue of approximately $37.10 million in 2024, reflecting a year-over-year decrease of -2.93% from 2023 revenue of $38.22 million. This segment includes apparel and gear like hats and bottle openers.
Select Legacy Soft Coolers: Certain older models in the soft cooler line may face increased competition and slower growth as newer, innovative Hopper M-Series models take priority. While specific revenue figures for legacy soft coolers are not separately broken out from the Coolers & Equipment segment (which grew 17% in 2024), their relative market share is diminishing against newer, prioritized product lines.
Low-Volume Wholesale Accounts: Non-strategic wholesale partners that require high sales effort but contribute little to the overall 1% to 2% projected total sales growth for FY 2025. This aligns with the broader wholesale channel caution seen in recent quarters. For example, in the second quarter of 2025, wholesale channel sales decreased 7% to $197 million, contrasting with the DTC channel sales increase of 2% to $249 million in the same period. Similarly, third quarter 2025 wholesale channel sales decreased 2% to $551.3 million.
The operational reality for these lower-tier wholesale relationships involves disproportionate resource allocation:
- High sales effort required for minimal revenue contribution.
- Low relative contribution to overall net sales growth.
- Potential for inventory mismatch with current consumer demand.
- Increased scrutiny given the company's focus on international expansion, which saw 31% growth in international sales in 2024.
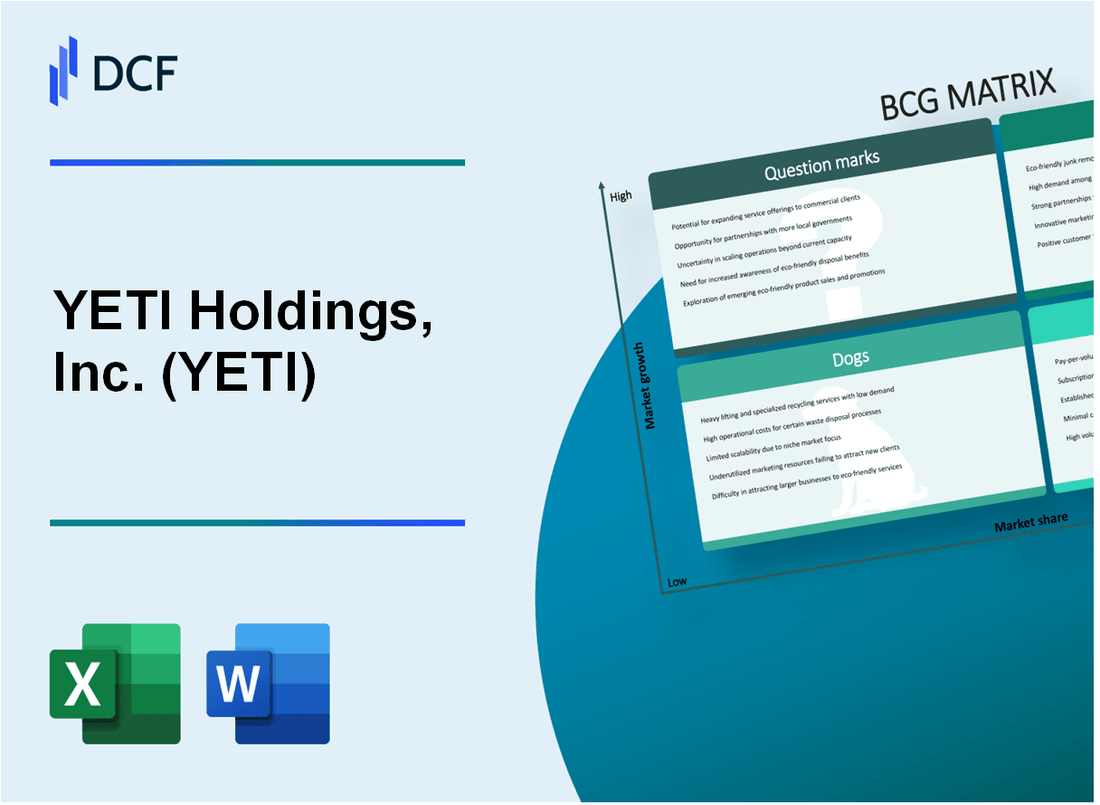
YETI Holdings, Inc. (YETI) - BCG Matrix: Question Marks
You're looking at the new, high-potential areas of YETI Holdings, Inc. (YETI) that are currently demanding cash to fuel growth but haven't yet secured a dominant market position. These are the units where the company is betting big for future Star status.
New Market Entry (Japan)
The foundational market entry into Japan, which officially launched in the second quarter of 2025, fits this profile perfectly. It's a high-growth market where YETI Holdings, Inc. is building brand presence from a low starting share. You can see the early traction in the international numbers; for the third quarter of 2025, international sales grew 14% to $100.4 million, with Japan showing increasing consumer enthusiasm. This expansion required significant upfront investment to build out the wholesale network, targeting growth from 17 doors at launch to a planned more than 400 doors by year-end. Overall, international sales are projected to grow between 15% and 20% for the full fiscal year 2025.
Hydration/Wellness Products
The push into new categories like hydration and wellness is a classic Question Mark move. YETI Holdings, Inc. made a definitive move here by acquiring certain assets related to a shaker bottle for $38 million in cash during the second quarter of 2025. This acquisition targets a roughly $2.5 billion market fueled by the demand for hydration powders and wellness products. The challenge is that the core Drinkware category, which this new product is meant to bolster, saw sales decline 4% to $236.4 million in the second quarter of 2025, and again by 4% to $264 million in the third quarter of 2025. The company needs this new innovation to quickly capture share in this new space to offset softness in the existing segment.
Supply Chain Diversification
The accelerated shift of drinkware production out of China is a high-risk, high-reward investment that is currently acting like a drain on near-term results. This strategic pivot caused inventory supply disruptions that management quantified as an unfavorable 300 basis points impact on the first-half 2025 sales outlook. The goal is to mitigate future risk, with the company expecting less than 5% of its total cost of goods sold to be exposed to U.S. tariffs on goods sourced from China by the end of 2025. To achieve this, YETI Holdings, Inc. accelerated its plan, aiming to have 80% of U.S. drinkware capacity located outside China by year-end 2025.
Cast Iron Cookware
The Cast Iron Cookware line extension, which was introduced in 2024, represents an entry into a new, premium category with high growth potential but a very low current revenue share. In the prior fiscal year, the 'Other' category, which would house this line, represented only 2% of total net sales. This product line requires continued investment to gain traction against established players in the premium cookware market.
Here's a quick look at the financial context for these growth areas:
| Metric | Value | Period/Context |
|---|---|---|
| Shaker Bottle Acquisition Cost | $38 million | Q2 2025 Cash Deal |
| Target Shaker Bottle Market Size | ~$2.5 billion | Addressable Market |
| Supply Chain Disruption Impact on Sales Outlook | 300 basis points | Unfavorable Impact in H1 2025 |
| Drinkware Sales (Q3 2025) | $264 million | Declined 4% Year-over-Year |
| Japan Distribution Doors (Target) | More than 400 | End of Fiscal Year 2025 Target |
| FY2025 International Sales Growth Projection | 15% to 20% | Full Year Guidance |
The strategy here is clear: you need to decide which of these Question Marks get the heavy investment to become Stars, and which ones you cut loose before they become Dogs. Finance: draft 13-week cash view by Friday.
Disclaimer
All information, articles, and product details provided on this website are for general informational and educational purposes only. We do not claim any ownership over, nor do we intend to infringe upon, any trademarks, copyrights, logos, brand names, or other intellectual property mentioned or depicted on this site. Such intellectual property remains the property of its respective owners, and any references here are made solely for identification or informational purposes, without implying any affiliation, endorsement, or partnership.
We make no representations or warranties, express or implied, regarding the accuracy, completeness, or suitability of any content or products presented. Nothing on this website should be construed as legal, tax, investment, financial, medical, or other professional advice. In addition, no part of this site—including articles or product references—constitutes a solicitation, recommendation, endorsement, advertisement, or offer to buy or sell any securities, franchises, or other financial instruments, particularly in jurisdictions where such activity would be unlawful.
All content is of a general nature and may not address the specific circumstances of any individual or entity. It is not a substitute for professional advice or services. Any actions you take based on the information provided here are strictly at your own risk. You accept full responsibility for any decisions or outcomes arising from your use of this website and agree to release us from any liability in connection with your use of, or reliance upon, the content or products found herein.