
|
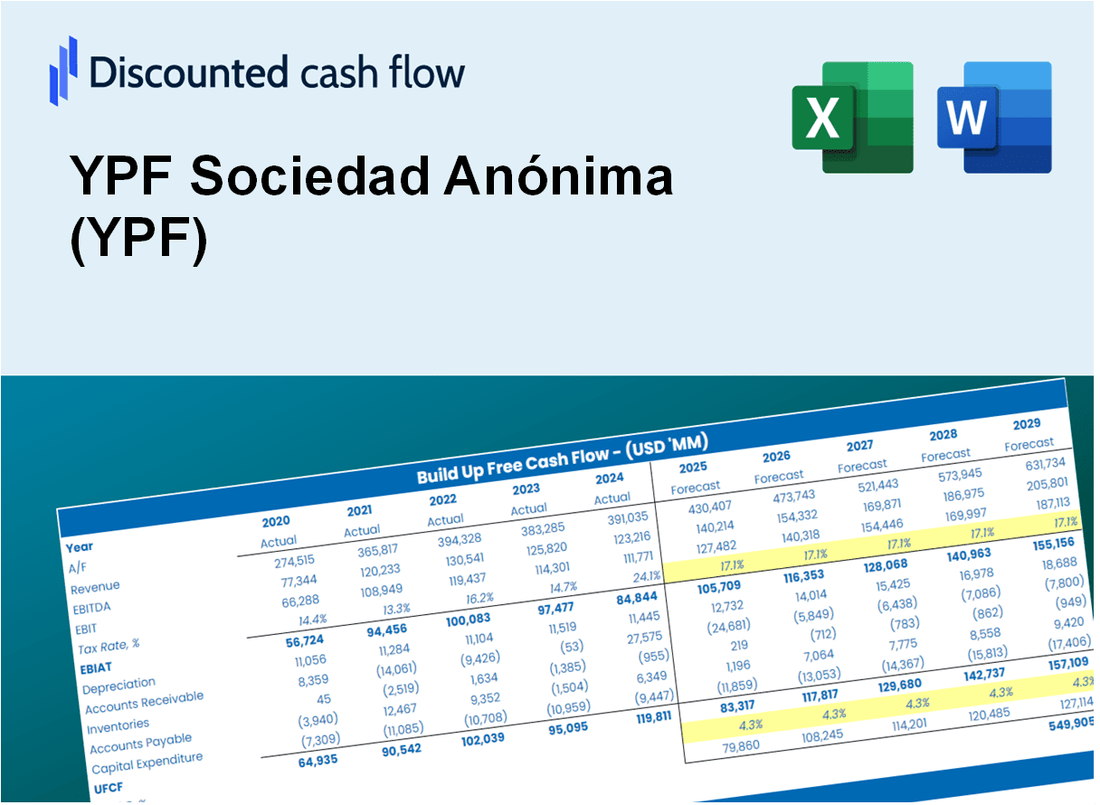
YPF Sociedad Anónima (YPF) DCF Valuation |
Fully Editable: Tailor To Your Needs In Excel Or Sheets
Professional Design: Trusted, Industry-Standard Templates
Investor-Approved Valuation Models
MAC/PC Compatible, Fully Unlocked
No Expertise Is Needed; Easy To Follow
YPF Sociedad Anónima (YPF) Bundle
Designed for accuracy, our YPF DCF Calculator helps you assess YPF Sociedad Anónima (YPF) valuation using real financial data and offers complete flexibility to modify all essential parameters for enhanced projections.
Discounted Cash Flow (DCF) - (USD MM)
| Year | AY1 2020 |
AY2 2021 |
AY3 2022 |
AY4 2023 |
AY5 2024 |
FY1 2025 |
FY2 2026 |
FY3 2027 |
FY4 2028 |
FY5 2029 |
|---|---|---|---|---|---|---|---|---|---|---|
| Revenue | 481.3 | 914.3 | 1,755.8 | 3,811.6 | 12,436.6 | 24,314.0 | 47,534.7 | 92,931.9 | 181,685.1 | 355,200.4 |
| Revenue Growth, % | 0 | 89.98 | 92.03 | 117.08 | 226.28 | 95.5 | 95.5 | 95.5 | 95.5 | 95.5 |
| EBITDA | 74.4 | 294.7 | 439.0 | 1,975.4 | 2,709.9 | 7,114.4 | 13,908.8 | 27,192.3 | 53,161.8 | 103,933.1 |
| EBITDA, % | 15.46 | 32.23 | 25 | 51.83 | 21.79 | 29.26 | 29.26 | 29.26 | 29.26 | 29.26 |
| Depreciation | 121.5 | 202.7 | 239.3 | 1,632.3 | 1,600.0 | 5,676.9 | 11,098.5 | 21,698.0 | 42,420.3 | 82,933.2 |
| Depreciation, % | 25.25 | 22.17 | 13.63 | 42.82 | 12.87 | 23.35 | 23.35 | 23.35 | 23.35 | 23.35 |
| EBIT | -47.1 | 91.9 | 199.7 | 343.1 | 1,109.9 | 1,437.5 | 2,810.3 | 5,494.3 | 10,741.5 | 20,999.9 |
| EBIT, % | -9.79 | 10.05 | 11.37 | 9 | 8.92 | 5.91 | 5.91 | 5.91 | 5.91 | 5.91 |
| Total Cash | 58.1 | .8 | .8 | 691.7 | 1.0 | 1,475.8 | 2,885.2 | 5,640.6 | 11,027.6 | 21,559.4 |
| Total Cash, percent | .0 | .0 | .0 | .0 | .0 | .0 | .0 | .0 | .0 | .0 |
| Account Receivables | .9 | 1.3 | 1.5 | .7 | 1,206.3 | 493.3 | 964.4 | 1,885.4 | 3,686.0 | 7,206.3 |
| Account Receivables, % | 0.19523 | 0.147 | 0.08319922 | 0.01870712 | 9.7 | 2.03 | 2.03 | 2.03 | 2.03 | 2.03 |
| Inventories | .8 | 1.0 | 1.2 | 839.3 | 1.1 | 1,088.5 | 2,128.0 | 4,160.3 | 8,133.5 | 15,901.3 |
| Inventories, % | 0.17198 | 0.11401 | 0.06879174 | 22.02 | 0.00863927 | 4.48 | 4.48 | 4.48 | 4.48 | 4.48 |
| Accounts Payable | 1.1 | 1.3 | 1.7 | 1.6 | 2,031.6 | 819.6 | 1,602.3 | 3,132.5 | 6,124.2 | 11,973.1 |
| Accounts Payable, % | 0.23494 | 0.1429 | 0.09887329 | 0.04166253 | 16.34 | 3.37 | 3.37 | 3.37 | 3.37 | 3.37 |
| Capital Expenditure | -79.7 | -163.2 | -369.8 | -1,105.7 | -3,742.9 | -5,571.0 | -10,891.5 | -21,293.2 | -41,628.9 | -81,386.0 |
| Capital Expenditure, % | -16.55 | -17.85 | -21.06 | -29.01 | -30.1 | -22.91 | -22.91 | -22.91 | -22.91 | -22.91 |
| Tax Rate, % | -114.07 | -114.07 | -114.07 | -114.07 | -114.07 | -114.07 | -114.07 | -114.07 | -114.07 | -114.07 |
| EBITAT | -58.2 | .4 | 1.1 | 609.2 | 2,376.1 | 865.3 | 1,691.6 | 3,307.1 | 6,465.5 | 12,640.4 |
| Depreciation | ||||||||||
| Changes in Account Receivables | ||||||||||
| Changes in Inventories | ||||||||||
| Changes in Accounts Payable | ||||||||||
| Capital Expenditure | ||||||||||
| UFCF | -16.9 | 39.5 | -129.3 | 298.3 | 1,895.7 | -615.2 | 1,170.8 | 2,288.9 | 4,474.8 | 8,748.4 |
| WACC, % | 5.07 | 3.86 | 3.86 | 5.07 | 5.07 | 4.58 | 4.58 | 4.58 | 4.58 | 4.58 |
| PV UFCF | ||||||||||
| SUM PV UFCF | 13,215.1 | |||||||||
| Long Term Growth Rate, % | 2.00 | |||||||||
| Free cash flow (T + 1) | 8,923 | |||||||||
| Terminal Value | 345,265 | |||||||||
| Present Terminal Value | 275,941 | |||||||||
| Enterprise Value | 289,156 | |||||||||
| Net Debt | 6,159 | |||||||||
| Equity Value | 282,997 | |||||||||
| Diluted Shares Outstanding, MM | 392 | |||||||||
| Equity Value Per Share | 721.77 |
What You Will Get
- Real YPF Financial Data: Pre-filled with YPF’s historical and projected data for precise analysis.
- Fully Editable Template: Modify key inputs like revenue growth, WACC, and EBITDA % with ease.
- Automatic Calculations: See YPF’s intrinsic value update instantly based on your changes.
- Professional Valuation Tool: Designed for investors, analysts, and consultants seeking accurate DCF results.
- User-Friendly Design: Simple structure and clear instructions for all experience levels.
Key Features
- Comprehensive Financial Data: YPF's (YPF) historical financial statements and pre-filled projections.
- Customizable Parameters: Adjust WACC, tax rates, revenue growth, and EBITDA margins as needed.
- Real-Time Valuation: Observe YPF’s intrinsic value recalculating instantly.
- Intuitive Visualizations: Dashboard charts showcase valuation outcomes and essential metrics.
- Designed for Precision: A reliable tool tailored for analysts, investors, and finance professionals.
How It Works
- Step 1: Download the Excel file.
- Step 2: Review pre-entered YPF data (historical and projected).
- Step 3: Adjust key assumptions (yellow cells) based on your analysis.
- Step 4: View automatic recalculations for YPF’s intrinsic value.
- Step 5: Use the outputs for investment decisions or reporting.
Why Choose This Calculator for YPF (YPF)?
- Designed for Industry Experts: A sophisticated tool utilized by financial analysts, executives, and consultants in the energy sector.
- Comprehensive Data: YPF’s historical and projected financials are preloaded for precise analysis.
- Flexible Scenario Analysis: Effortlessly simulate various forecasts and assumptions tailored to the energy market.
- Insightful Outputs: Automatically computes intrinsic value, NPV, and essential financial metrics.
- User-Friendly: Intuitive, step-by-step instructions lead you seamlessly through the calculations.
Who Should Use This Product?
- Finance Students: Master valuation techniques and apply them using real data for YPF (YPF).
- Academics: Integrate professional models into your coursework or research focused on YPF (YPF).
- Investors: Validate your own assumptions and analyze valuation outcomes for YPF (YPF) stock.
- Analysts: Enhance your workflow with a ready-to-use, customizable DCF model for YPF (YPF).
- Small Business Owners: Understand how large public companies like YPF (YPF) are evaluated.
What the Template Contains
- Operating and Balance Sheet Data: Pre-filled YPF historical data and forecasts, including revenue, EBITDA, EBIT, and capital expenditures.
- WACC Calculation: A dedicated sheet for Weighted Average Cost of Capital (WACC), including parameters like Beta, risk-free rate, and share price.
- DCF Valuation (Unlevered and Levered): Editable Discounted Cash Flow models showing intrinsic value with detailed calculations.
- Financial Statements: Pre-loaded financial statements (annual and quarterly) to support analysis.
- Key Ratios: Includes profitability, leverage, and efficiency ratios for YPF (YPF).
- Dashboard and Charts: Visual summary of valuation outputs and assumptions to analyze results easily.
Disclaimer
All information, articles, and product details provided on this website are for general informational and educational purposes only. We do not claim any ownership over, nor do we intend to infringe upon, any trademarks, copyrights, logos, brand names, or other intellectual property mentioned or depicted on this site. Such intellectual property remains the property of its respective owners, and any references here are made solely for identification or informational purposes, without implying any affiliation, endorsement, or partnership.
We make no representations or warranties, express or implied, regarding the accuracy, completeness, or suitability of any content or products presented. Nothing on this website should be construed as legal, tax, investment, financial, medical, or other professional advice. In addition, no part of this site—including articles or product references—constitutes a solicitation, recommendation, endorsement, advertisement, or offer to buy or sell any securities, franchises, or other financial instruments, particularly in jurisdictions where such activity would be unlawful.
All content is of a general nature and may not address the specific circumstances of any individual or entity. It is not a substitute for professional advice or services. Any actions you take based on the information provided here are strictly at your own risk. You accept full responsibility for any decisions or outcomes arising from your use of this website and agree to release us from any liability in connection with your use of, or reliance upon, the content or products found herein.