
|
17 Education & Technology Group Inc. (YQ): 5 FORCES Analysis [Nov-2025 Updated] |
Fully Editable: Tailor To Your Needs In Excel Or Sheets
Professional Design: Trusted, Industry-Standard Templates
Investor-Approved Valuation Models
MAC/PC Compatible, Fully Unlocked
No Expertise Is Needed; Easy To Follow
17 Education & Technology Group Inc. (YQ) Bundle
You're sifting through the wreckage of the old Chinese EdTech model, and the latest numbers for 17 Education & Technology Group Inc. (YQ) are a study in contrasts: Q2 2025 revenue dropped to RMB 25.4 million, yet the gross margin impressively hit 57.5% as cost of revenues fell 81% year-over-year to RMB 10.8 million. Honestly, the company is now entirely dependent on securing those government-approved, in-school SaaS deals, which completely redefines who holds the power. Before you make any investment call, you need to see how the regulatory vise has squeezed every force-from suppliers to new entrants-in this new landscape. This is the new playbook.
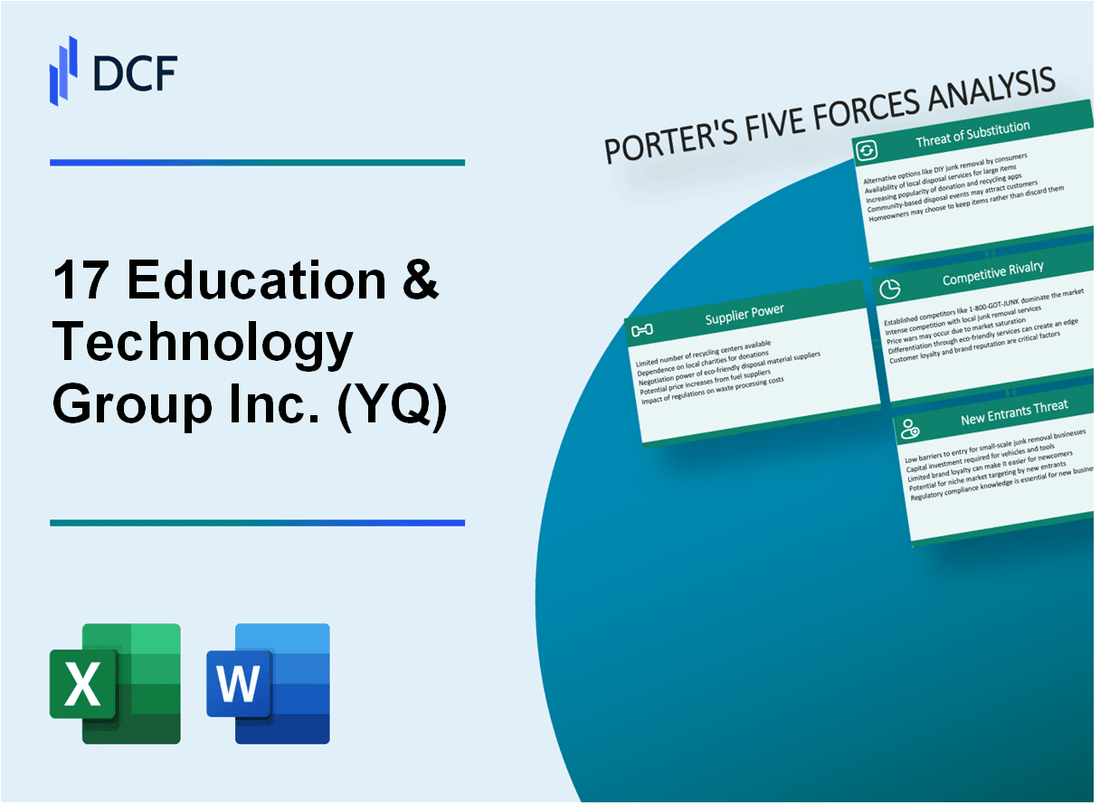
17 Education & Technology Group Inc. (YQ) - Porter's Five Forces: Bargaining power of suppliers
When we look at the Bargaining Power of Suppliers for 17 Education & Technology Group Inc. (YQ), we see a mixed picture, but one that management seems to be actively controlling through vertical integration and operational efficiency.
Technology and AI infrastructure providers hold moderate power. You're running a data-driven SaaS platform, so your reliance on cloud services, data processing, and specialized AI compute is non-negotiable. However, because 17 Education & Technology Group Inc. has built its core offering-the smart in-school classroom solution-around its proprietary technology and data insights, the switching costs to move that entire integrated system to a new cloud backbone are high. This dependency gives the infrastructure players some leverage, but the stickiness of YQ's platform mitigates that pressure somewhat.
For content creators and curriculum experts, the power dynamic leans toward low to moderate. Honestly, this is where YQ's decade-plus of in-school business expertise really pays off. The company explicitly focuses on Content Development and leverages its technology to create personalized and targeted learning content. When you develop the bulk of your own AI-powered, data-driven content, you reduce your reliance on external third-party curriculum providers, which naturally lowers their bargaining power.
Here's a quick look at the general operational suppliers. For things like basic bandwidth or standard office rentals, their power is low. These are highly commoditized inputs; you can swap out one general service provider for another without disrupting the core SaaS delivery mechanism. It's the specialized tech stack where the real negotiation happens.
The most concrete evidence of successful supplier cost management comes directly from the recent financials. Management's focus on efficiency is clearly working to reduce the cost associated with service delivery, which often includes supplier costs. Check out the numbers from the second quarter of 2025:
| Metric | Q2 2025 Amount | Q2 2024 Amount | Year-over-Year Change |
|---|---|---|---|
| Cost of Revenues | RMB 10.8 million | RMB 56.7 million | -81% |
That 81% year-over-year decrease in Cost of Revenues is significant. It signals a successful reduction in overall supplier and delivery costs, which was mainly attributed to the decrease in project deliveries for their teaching and learning SaaS offerings during the quarter. This suggests either better contract terms or a strategic shift away from high-cost, low-margin project work.
To summarize the forces impacting supplier power, you can see the levers 17 Education & Technology Group Inc. is pulling:
- AI Infrastructure: Moderate power due to high dependency on specialized compute.
- Content/Curriculum: Low to moderate power, thanks to in-house development.
- General Operations: Low power due to commoditized services.
- Cost Impact: Supplier/delivery cost pressures were significantly eased, evidenced by the 81% drop in Cost of Revenues in Q2 2025.
Finance: draft the Q3 2025 supplier cost variance analysis by next Tuesday.
17 Education & Technology Group Inc. (YQ) - Porter's Five Forces: Bargaining power of customers
You're looking at the customer power dynamic for 17 Education & Technology Group Inc. (YQ) right now, and it's clear that the customer base-primarily schools and educational authorities-holds significant sway. This power is amplified because the primary revenue stream is now centered on school-based Software as a Service (SaaS) projects. When your main contracts are with institutions, you are negotiating with a concentrated group, which inherently raises their leverage over pricing and terms.
The financial results from late 2025 clearly illustrate the pressure this dynamic exerts. For the second quarter of 2025, net revenues for 17 Education & Technology Group Inc. were RMB25.4 million (US$3.5 million). This figure represents a substantial year-over-year decrease of 62.4% compared to the RMB67.5 million in net revenues reported for the second quarter of 2024. Honestly, that drop shows the market-and by extension, the customers-are dictating the revenue reality on the ground, especially since management noted the Q2 2025 revenue drop was mainly due to a decrease in project deliveries for their teaching and learning SaaS offerings.
To get a full picture of this revenue volatility, look at the sequential data:
| Metric | Q1 2025 Amount (RMB million) | Q2 2025 Amount (RMB million) | Year-over-Year Change (Q2 2025 vs Q2 2024) |
| Net Revenues | 21.7 | 25.4 | -62.4% |
| Gross Margin | 36.2% | 57.5% | Increase from 16.0% |
The shift to a SaaS model, while strategic for long-term relationships, introduces near-term friction. For instance, in Q1 2025, the company saw a year-over-year revenue decrease of 15.0% partly because the increasing number of SaaS contracts requires a longer period for revenue recognition, meaning the cash flow timing is dictated by the contract structure, not just the service delivery.
However, 17 Education & Technology Group Inc. employs a strategy that simultaneously limits customer leverage in one area while increasing it in another. They use a low-cost entry point to secure adoption:
- Core functions of in-school products are offered for free.
- This strategy builds a massive user base of teachers, students, and parents.
- The large installed base becomes a barrier to switching for schools.
- The free offering limits the customer's immediate revenue leverage on the basic service.
Still, the ultimate customer here isn't just the school principal; it's the regulatory environment. Government regulation acts as the final arbiter, dictating the scope of products allowed and, critically, the pricing for in-school services. Any company operating in this space must build its entire strategy around compliance and policy shifts, which is a massive external constraint on pricing power. The company itself acknowledges that relevant government policies and laws are a key factor affecting its business, making the regulatory body the most powerful customer of all.
Finance: draft 13-week cash view by Friday.
17 Education & Technology Group Inc. (YQ) - Porter's Five Forces: Competitive rivalry
The competitive rivalry within the post-regulation EdTech market for government-approved in-school Software as a Service (SaaS) contracts is definitely high. You see, the massive regulatory shift from the 'Double Reduction' policy effectively decimated the large, consumer-facing after-school tutoring sector, which was valued at billions of dollars prior to the July 2021 crackdown. This regulatory action forced many large, established EdTech players to pivot their entire business models toward in-school solutions and services that align with government priorities, like data-driven teaching and learning tools.
17 Education & Technology Group Inc. (YQ) finds itself competing directly against these other large EdTech firms that have made the same strategic shift. Competitors in the broader or pivoted K-12 space include firms like Lixiang Education, PowerSchool, Zhangmen Education, Kaiyuan Education Technology Group, VisionSys AI, and Litmos. Furthermore, the sector still contends with the legacy of giants like New Oriental and TAL Education Group, who are also navigating this new environment. The overall China EdTech market was valued at approximately US$57.3 billion in 2023, indicating a large, albeit reshaped, prize for market share in the in-school segment.
However, the rivalry is somewhat mitigated by 17 Education & Technology Group Inc.'s existing scale and deep integration within the system. The company leverages its extensive knowledge and expertise obtained from its in-school business over the past decade. This history means 17 Education & Technology Group Inc. already has established relationships and integration with numerous K-12 schools, which is a significant barrier to entry for competitors focused solely on the new SaaS contracts.
The financial results from the second quarter of 2025 reflect this strategic focus on the school-based model, even as top-line revenue contracted due to longer revenue recognition periods for these new contracts. You can see the margin improvement clearly in the comparison below:
| Metric | Q2 2025 | Q2 2024 |
|---|---|---|
| Net Revenues (RMB) | RMB25.4 million | RMB67.5 million |
| Gross Margin (%) | 57.5% | 16.0% |
| Net Loss (GAAP) (RMB) | RMB26.0 million | RMB55.7 million |
The Gross Margin improvement to 57.5% in Q2 2025, up from 16.0% in Q2 2024, strongly suggests better cost management and a favorable shift in the revenue mix toward higher-margin SaaS projects, despite the 62.4% year-over-year decline in net revenues to RMB25.4 million. This operational efficiency is key in a highly competitive environment where rivals are also fighting for limited government-approved contracts.
The competitive dynamics are shaped by the following factors:
- The pivot by large firms from after-school tutoring to in-school SaaS.
- The government's prioritization of non-subject-based learning and digital transformation.
- 17 Education & Technology Group Inc.'s decade-long in-school experience.
- The significant revenue decline of 62.4% in Q2 2025, pressuring all players to secure contracts.
- The substantial Gross Margin increase to 57.5% in Q2 2025, signaling a focus on profitable business.
Finance: draft a sensitivity analysis on contract win rates vs. Gross Margin targets by next Tuesday.
17 Education & Technology Group Inc. (YQ) - Porter's Five Forces: Threat of substitutes
You're analyzing the competitive landscape for 17 Education & Technology Group Inc. (YQ), and the threat of substitutes is definitely a major factor to consider, especially given the sheer scale of alternative educational pathways available in China.
The market for supplemental, non-platform learning remains enormous, creating a persistent, high-pressure substitute environment. The China after-school tutoring market, for instance, was valued at USD 99.32 billion in 2025, with projections showing it could reach USD 168.87 billion by 2030, growing at a Compound Annual Growth Rate (CAGR) between 11.23% and 18.3%. This massive, growing market represents direct competition for student and parental time/spending, even if the delivery model (human tutors) differs from 17 Education & Technology Group Inc.'s SaaS focus. Furthermore, the digital substitute space is also expanding rapidly; the China K-12 online education market is forecast to grow by USD 31.16 billion between 2024 and 2029 at a 16.3% CAGR.
The existence of large, government-backed, free digital resources further dilutes the perceived value of paid content. The 'Smart Education of China' online platform, for example, had topped 164 million registered users as of April 2025 and hosts over 110,000 primary and secondary school resources. This abundance of free, high-volume content acts as a baseline substitute for any non-differentiated educational material 17 Education & Technology Group Inc. might offer.
However, government mandates work in the other direction, helping to solidify the position of in-school technology providers like 17 Education & Technology Group Inc. China has mandated AI education for all primary and secondary students starting September 1, 2025, with a minimum of eight hours of instruction annually. This forces technology adoption into the core school day, which is where 17 Education & Technology Group Inc.'s core SaaS offerings are focused. To be fair, the Ministry of Education has established guidelines banning teachers from using generative AI as a substitute for their core teaching responsibilities, which helps protect the role of the human educator and, by extension, the need for integrated classroom management tools.
The high switching cost argument hinges on the depth of integration, not just the presence of content. 17 Education & Technology Group Inc.'s own profile notes that the core functions of its in-school products are free of charge for teachers, students, and parents. This implies that the high switching cost is tied to the paid, data-driven SaaS layer-the multi-role reporting and data insights used for instructional decision-making-rather than the basic content itself. If a school district has fully integrated the data analytics and assessment workflows, the cost to rip out that system and retrain 340 employees (the company's reported staff count) on a new platform becomes substantial, locking in revenue streams despite the low-cost content substitutes.
The threat from direct teacher-created digital content is mitigated by the nature of 17 Education & Technology Group Inc.'s value proposition, which is data-driven. While teachers can create content for free, they cannot easily replicate the personalized, targeted learning and exercise content derived from the Company's technology and data insights, which is aimed at improving student efficiency. The financial reality of Q2 2025 shows the company is prioritizing this school-based SaaS model, with Net Revenues for that quarter at RMB 25.4 million, a significant portion of which is expected to be recurring subscription revenue.
Here is a quick comparison of the scale of the substitute market versus 17 Education & Technology Group Inc.'s recent revenue:
| Category | Metric/Value (Late 2025/Forecast) | Data Point |
|---|---|---|
| 17 Education & Technology Group Inc. (YQ) Q2 2025 Revenue | RMB 25.4 million | Reported Q2 2025 Net Revenue |
| China After-School Tutoring Market Size (2025) | USD 99.32 billion | Estimated market value in 2025 |
| China K-12 Online Education Market Growth (2024-2029) | USD 31.16 billion | Forecasted market size increase |
| Smart Education of China Platform Registered Users (April 2025) | 164 million users | Platform user base |
| Mandated AI Instruction Time (Annual) | Eight hours | Minimum annual AI instruction for K-12 students |
The core issue for you is that while the government is mandating some tech integration, the sheer size of the private tutoring market (USD 99.32 billion in 2025) and the massive free digital resource base mean that any perceived weakness in YQ's data-driven tools will immediately be filled by a substitute.
17 Education & Technology Group Inc. (YQ) - Porter's Five Forces: Threat of new entrants
The threat of new entrants for 17 Education & Technology Group Inc. (YQ) in the K-12 sector is low, primarily because of the severe regulatory environment in China. The sweeping overhaul initiated in July 2021, often called the "Double Reduction" policy, banned companies teaching school curriculum subjects from making profits, raising capital, or listing on stock exchanges worldwide. This immediately erected a massive barrier for any potential new for-profit entrant focused on the core K-12 curriculum subjects.
Furthermore, specific rules target ownership and operation. Regulations state that foreign-invested enterprises, as well as social organizations with foreign controllers, are banned from running private schools at the compulsory education level. To be fair, any new domestic player must also contend with the fact that all board members and decision-making body members for a private school at the compulsory education level must have Chinese nationality. Navigating this distinct regulatory landscape and adapting content to local standards and language incurs significant, non-replicable upfront costs for newcomers.
Building the necessary technological foundation presents a steep capital hurdle. While 17 Education & Technology Group Inc. reported cash and cash equivalents, restricted cash and term deposits totaling RMB333.3 million (US$45.9 million) as of March 31, 2025, any new entrant aiming to compete with YQ's 'AI-powered solutions' must commit substantial, sustained capital to AI development and data infrastructure to even approach parity. The sheer scale of the market they would be entering, even post-regulation, is immense; the Chinese K-12 education training market was estimated at around $120 billion in 2019.
Here's a quick look at some of 17 Education & Technology Group Inc.'s recent financial context as of Q1 2025, which shows the operational scale that new entrants would need to match or surpass:
| Metric | Value (Q1 2025) | Context/Date |
|---|---|---|
| Net Revenues | RMB21.7 million (US$3.0 million) | Unaudited, for the first quarter ended March 31, 2025 |
| Gross Margin | 36.2% | Q1 2025 |
| Net Loss | RMB30.9 million (US$4.3 million) | Q1 2025 |
| Cash & Equivalents (End of Q1) | RMB333.3 million (US$45.9 million) | As of March 31, 2025 |
| Company Experience in In-School Business | Over a decade | Leveraged expertise |
Beyond capital and regulation, overcoming the incumbent's established presence is a major hurdle. 17 Education & Technology Group Inc. leverages its 'extensive knowledge and expertise obtained from in-school business over the past decade' to build trust with educational authorities and secure contracts. New entrants simply cannot easily replicate this decade-long accumulation of relationships and on-the-ground operational experience. This history translates directly into the data advantage; the company's personalized products utilize its 'technology and data insights' which are massive and accumulated over time, making them nearly impossible for a startup to match quickly.
The barriers to entry are therefore structural, not just financial. You're looking at a market where the government has effectively capped the most lucrative business model, and the remaining viable in-school model requires deep, long-term institutional trust and proprietary data sets built over ten years.
Disclaimer
All information, articles, and product details provided on this website are for general informational and educational purposes only. We do not claim any ownership over, nor do we intend to infringe upon, any trademarks, copyrights, logos, brand names, or other intellectual property mentioned or depicted on this site. Such intellectual property remains the property of its respective owners, and any references here are made solely for identification or informational purposes, without implying any affiliation, endorsement, or partnership.
We make no representations or warranties, express or implied, regarding the accuracy, completeness, or suitability of any content or products presented. Nothing on this website should be construed as legal, tax, investment, financial, medical, or other professional advice. In addition, no part of this site—including articles or product references—constitutes a solicitation, recommendation, endorsement, advertisement, or offer to buy or sell any securities, franchises, or other financial instruments, particularly in jurisdictions where such activity would be unlawful.
All content is of a general nature and may not address the specific circumstances of any individual or entity. It is not a substitute for professional advice or services. Any actions you take based on the information provided here are strictly at your own risk. You accept full responsibility for any decisions or outcomes arising from your use of this website and agree to release us from any liability in connection with your use of, or reliance upon, the content or products found herein.