
|
Zomedica Corp. (ZOM) DCF Valuation |
Fully Editable: Tailor To Your Needs In Excel Or Sheets
Professional Design: Trusted, Industry-Standard Templates
Investor-Approved Valuation Models
MAC/PC Compatible, Fully Unlocked
No Expertise Is Needed; Easy To Follow
Zomedica Corp. (ZOM) Bundle
Evaluate Zomedica Corp. (ZOM) financial outlook like an expert! This (ZOM) DCF Calculator provides pre-filled financial data along with the flexibility to modify revenue growth, WACC, margins, and other essential assumptions to align with your projections.
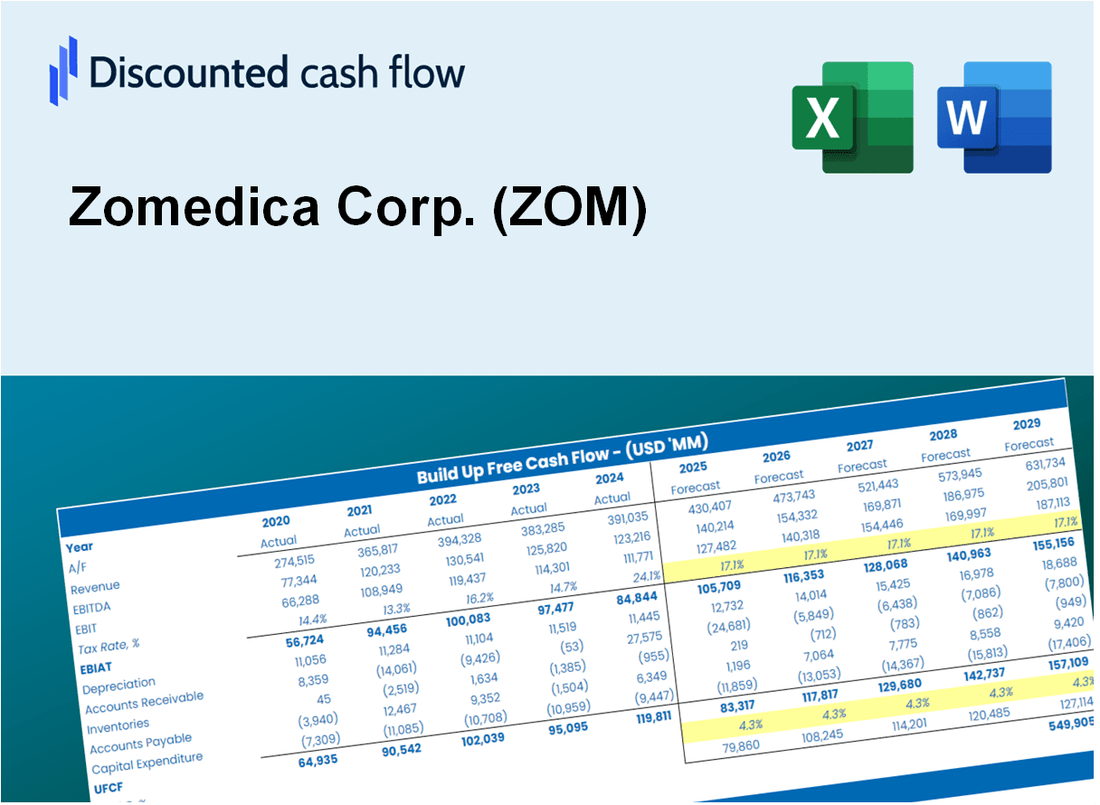
Discounted Cash Flow (DCF) - (USD MM)
| Year | AY1 2020 |
AY2 2021 |
AY3 2022 |
AY4 2023 |
AY5 2024 |
FY1 2025 |
FY2 2026 |
FY3 2027 |
FY4 2028 |
FY5 2029 |
|---|---|---|---|---|---|---|---|---|---|---|
| Revenue | .0 | .0 | 4.1 | 18.9 | 25.2 | 33.6 | 44.7 | 59.6 | 79.4 | 105.9 |
| Revenue Growth, % | 0 | 0 | 0 | 358.01 | 33.05 | 33.26 | 33.26 | 33.26 | 33.26 | 33.26 |
| EBITDA | -19.0 | -16.4 | -19.6 | -15.3 | -29.4 | -5.4 | -7.2 | -9.7 | -12.9 | -17.2 |
| EBITDA, % | 100 | 100 | -473.51 | -81.02 | -116.68 | -16.2 | -16.2 | -16.2 | -16.2 | -16.2 |
| Depreciation | .8 | .5 | 1.1 | 4.0 | 6.3 | 18.4 | 24.5 | 32.7 | 43.5 | 58.0 |
| Depreciation, % | 100 | 100 | 27.57 | 21.35 | 25.01 | 54.79 | 54.79 | 54.79 | 54.79 | 54.79 |
| EBIT | -19.8 | -16.9 | -20.7 | -19.4 | -35.7 | -6.7 | -8.9 | -11.9 | -15.9 | -21.2 |
| EBIT, % | 100 | 100 | -501.08 | -102.38 | -141.69 | -20 | -20 | -20 | -20 | -20 |
| Total Cash | .5 | 62.0 | 195.0 | 115.1 | 90.5 | 33.6 | 44.7 | 59.6 | 79.4 | 105.9 |
| Total Cash, percent | .0 | .0 | .0 | .0 | .0 | .0 | .0 | .0 | .0 | .0 |
| Account Receivables | .0 | .1 | .8 | 1.9 | 2.2 | 15.9 | 21.2 | 28.3 | 37.7 | 50.2 |
| Account Receivables, % | 100 | 100 | 18.52 | 9.85 | 8.73 | 47.42 | 47.42 | 47.42 | 47.42 | 47.42 |
| Inventories | .0 | .0 | 2.8 | 2.7 | 5.1 | 20.4 | 27.2 | 36.2 | 48.3 | 64.3 |
| Inventories, % | 100 | 100 | 68.91 | 14.51 | 20.34 | 60.75 | 60.75 | 60.75 | 60.75 | 60.75 |
| Accounts Payable | 2.1 | 1.2 | 3.2 | 6.7 | 7.7 | 23.1 | 30.8 | 41.0 | 54.6 | 72.8 |
| Accounts Payable, % | 100 | 100 | 78.03 | 35.38 | 30.45 | 68.77 | 68.77 | 68.77 | 68.77 | 68.77 |
| Capital Expenditure | -.7 | .0 | -.5 | -1.0 | -4.6 | -2.5 | -3.3 | -4.4 | -5.8 | -7.7 |
| Capital Expenditure, % | 100 | 100 | -12.73 | -5.42 | -18.45 | -7.32 | -7.32 | -7.32 | -7.32 | -7.32 |
| Tax Rate, % | 3.71 | 3.71 | 3.71 | 3.71 | 3.71 | 3.71 | 3.71 | 3.71 | 3.71 | 3.71 |
| EBITAT | -19.8 | -16.9 | -18.4 | -17.0 | -34.4 | -6.3 | -8.5 | -11.3 | -15.0 | -20.0 |
| Depreciation | ||||||||||
| Changes in Account Receivables | ||||||||||
| Changes in Inventories | ||||||||||
| Changes in Accounts Payable | ||||||||||
| Capital Expenditure | ||||||||||
| UFCF | -17.6 | -17.4 | -19.3 | -11.5 | -34.4 | -4.0 | 8.4 | 11.2 | 14.9 | 19.8 |
| WACC, % | 8.84 | 8.84 | 8.82 | 8.82 | 8.83 | 8.83 | 8.83 | 8.83 | 8.83 | 8.83 |
| PV UFCF | ||||||||||
| SUM PV UFCF | 35.6 | |||||||||
| Long Term Growth Rate, % | 2.00 | |||||||||
| Free cash flow (T + 1) | 20 | |||||||||
| Terminal Value | 296 | |||||||||
| Present Terminal Value | 194 | |||||||||
| Enterprise Value | 229 | |||||||||
| Net Debt | -10 | |||||||||
| Equity Value | 240 | |||||||||
| Diluted Shares Outstanding, MM | 980 | |||||||||
| Equity Value Per Share | 0.24 |
What You Will Get
- Comprehensive ZOM Financials: Access historical and projected data for precise valuation.
- Customizable Inputs: Adjust WACC, tax rates, revenue growth, and capital expenditures as needed.
- Dynamic Calculations: Intrinsic value and NPV are computed in real-time.
- Scenario Analysis: Explore various scenarios to assess Zomedica’s future performance.
- User-Friendly Interface: Designed for professionals while remaining approachable for newcomers.
Key Features
- Comprehensive Data: Zomedica Corp.'s historical financial statements and pre-populated projections.
- Customizable Variables: Adjust inputs for WACC, tax rates, revenue growth, and EBITDA margins.
- Real-Time Insights: Monitor Zomedica's intrinsic value updates instantly.
- Visual Analytics: Dashboard graphs illustrate valuation outcomes and essential metrics.
- Designed for Precision: A professional-grade tool for analysts, investors, and finance professionals.
How It Works
- Step 1: Download the Excel file.
- Step 2: Review Zomedica Corp.'s pre-filled financial data and forecasts.
- Step 3: Modify key inputs such as revenue growth, WACC, and tax rates (highlighted cells).
- Step 4: Observe the DCF model update in real-time as you adjust assumptions.
- Step 5: Analyze the results and apply the findings for your investment strategy.
Why Choose This Calculator for Zomedica Corp. (ZOM)?
- Precision: Utilizes Zomedica's actual financials for reliable data accuracy.
- Adaptability: Built to allow users to easily adjust and experiment with inputs.
- Efficiency: Eliminate the need to create a DCF model from the ground up.
- Expert-Level: Crafted with the expertise and usability of CFOs in mind.
- Intuitive: Simple to navigate, making it accessible for users without extensive financial modeling skills.
Who Should Use This Product?
- Professional Investors: Develop comprehensive and accurate valuation models for portfolio assessment related to Zomedica Corp. (ZOM).
- Corporate Finance Teams: Evaluate valuation scenarios to inform strategic decisions within their organizations regarding Zomedica Corp. (ZOM).
- Consultants and Advisors: Offer clients precise valuation insights for investments in Zomedica Corp. (ZOM).
- Students and Educators: Utilize real-market data to practice and teach financial modeling with a focus on Zomedica Corp. (ZOM).
- Healthcare Enthusiasts: Gain insights into how companies like Zomedica Corp. (ZOM) are valued within the healthcare sector.
What the Template Contains
- Operating and Balance Sheet Data: Pre-filled Zomedica Corp. (ZOM) historical data and forecasts, including revenue, EBITDA, EBIT, and capital expenditures.
- WACC Calculation: A dedicated sheet for Weighted Average Cost of Capital (WACC), including parameters like Beta, risk-free rate, and share price.
- DCF Valuation (Unlevered and Levered): Editable Discounted Cash Flow models showing intrinsic value with detailed calculations.
- Financial Statements: Pre-loaded financial statements (annual and quarterly) to support analysis.
- Key Ratios: Includes profitability, leverage, and efficiency ratios for Zomedica Corp. (ZOM).
- Dashboard and Charts: Visual summary of valuation outputs and assumptions to analyze results easily.
Disclaimer
All information, articles, and product details provided on this website are for general informational and educational purposes only. We do not claim any ownership over, nor do we intend to infringe upon, any trademarks, copyrights, logos, brand names, or other intellectual property mentioned or depicted on this site. Such intellectual property remains the property of its respective owners, and any references here are made solely for identification or informational purposes, without implying any affiliation, endorsement, or partnership.
We make no representations or warranties, express or implied, regarding the accuracy, completeness, or suitability of any content or products presented. Nothing on this website should be construed as legal, tax, investment, financial, medical, or other professional advice. In addition, no part of this site—including articles or product references—constitutes a solicitation, recommendation, endorsement, advertisement, or offer to buy or sell any securities, franchises, or other financial instruments, particularly in jurisdictions where such activity would be unlawful.
All content is of a general nature and may not address the specific circumstances of any individual or entity. It is not a substitute for professional advice or services. Any actions you take based on the information provided here are strictly at your own risk. You accept full responsibility for any decisions or outcomes arising from your use of this website and agree to release us from any liability in connection with your use of, or reliance upon, the content or products found herein.