
|
Zurn Elkay Water Solutions Corporation (ZWS): PESTLE Analysis [Nov-2025 Updated] |
Fully Editable: Tailor To Your Needs In Excel Or Sheets
Professional Design: Trusted, Industry-Standard Templates
Investor-Approved Valuation Models
MAC/PC Compatible, Fully Unlocked
No Expertise Is Needed; Easy To Follow
Zurn Elkay Water Solutions Corporation (ZWS) Bundle
You're looking for a clear, actionable breakdown of the external forces shaping Zurn Elkay Water Solutions Corporation (ZWS), and honestly, the investment landscape is defintely defined by massive infrastructure dollars and shifting public health priorities. The biggest near-term opportunity is the government's push on water quality, specifically the federal funding supporting lead-free mandates; the biggest risk is the drag from high interest rates slowing new commercial construction, which is projected to be nearly flat in 2025. We need to map these out precisely to understand ZWS's path forward.
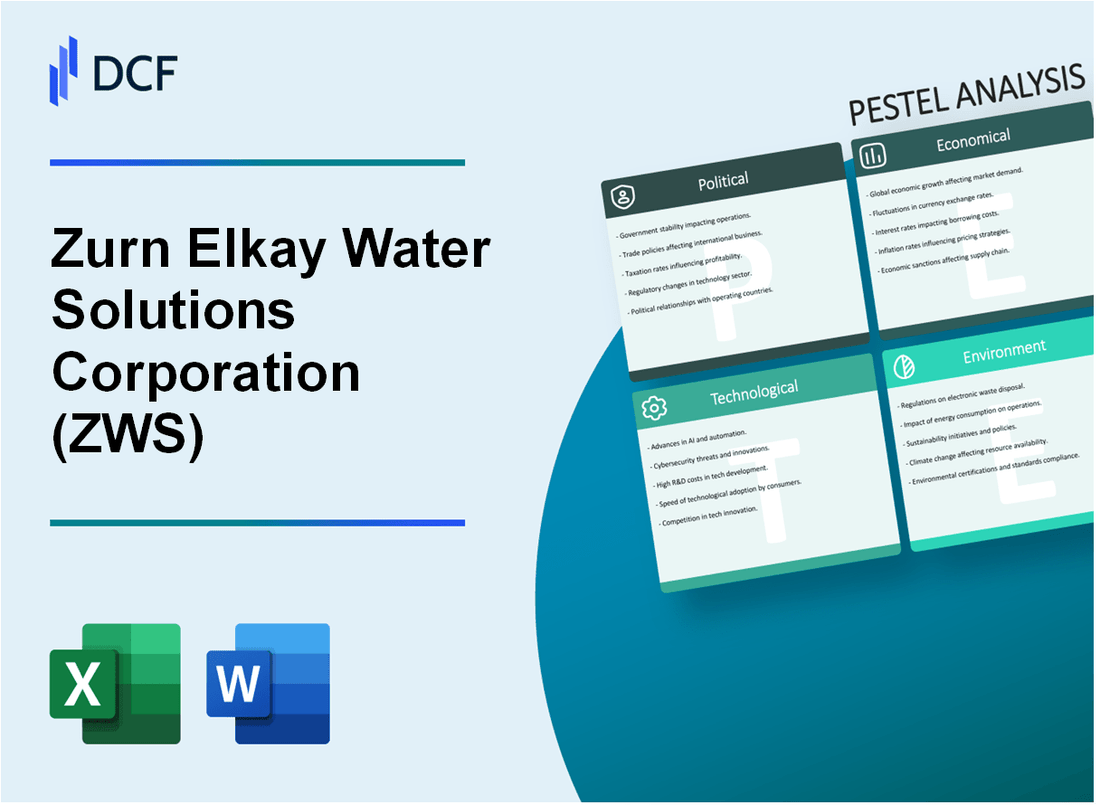
Zurn Elkay Water Solutions Corporation (ZWS) - PESTLE Analysis: Political factors
Infrastructure spending drives demand for water safety products.
You need to understand that federal infrastructure policy is not a slow-burn for Zurn Elkay Water Solutions Corporation; it's a direct revenue accelerant. The Bipartisan Infrastructure Law (BIL) is the biggest driver here, dedicating over $50 billion to water and wastewater upgrades. This isn't just theory-it creates a massive, mandated demand for the lead-free products Zurn Elkay sells, like commercial faucets, valves, and drinking fountains.
Specifically, the law includes a dedicated $15 billion over five years (Fiscal Year 2022-2026) for lead service line replacement alone. This means municipal water systems across the country have the capital to execute large-scale overhauls. The Environmental Protection Agency (EPA) estimates the annual cost of complying with the new Lead and Copper Rule Improvements (LCRI) is between $1.5 billion and $2 billion, which is a sustained, multi-year revenue stream for the industry. That is a clear, decade-long tailwind for the water safety sector.
Federal funding from the Bipartisan Infrastructure Law supports school and municipal water projects.
The federal government is forcing the issue on lead and then paying for a large part of the solution, which is a perfect setup for a company like Zurn Elkay. The EPA's final LCRI rule requires drinking water systems to prioritize lead pipe removal at schools and childcare facilities.
For Fiscal Year 2025, the BIL appropriates $45 million specifically for lead testing, compliance monitoring, and remediation in schools. This is direct funding for the non-residential market, which is a core strength for Zurn Elkay. The company's strong performance in 2025, with Q3 net sales hitting $455.4 million (an 11% year-over-year increase), defintely shows they are capturing this infrastructure-driven demand.
Here's the quick math on the federal commitment for lead abatement:
- Total BIL Water Investment: Over $50 billion
- Dedicated Lead Service Line Replacement: $15 billion (over 5 years)
- FY 2025 School Lead Remediation Funding: $45 million
Trade policies and tariffs on raw materials (like copper and steel) impact input costs.
While demand is strong, the political landscape cuts both ways, particularly on raw material costs. New trade policies have significantly increased the cost of key inputs for Zurn Elkay's products, which use substantial amounts of brass, a copper and zinc alloy.
As of August 1, 2025, a Section 232 tariff of 50% was imposed on all semi-finished copper products, including tubing, rods, and copper-based fittings. This is a massive cost shock. Additionally, tariffs on steel and aluminum rose to 25% in early 2025. The market reaction has been swift, with copper prices surging 38% in the past year alone. This forces Zurn Elkay to either pass costs to customers or manage margins very tightly, but their full-year 2025 Adjusted EBITDA outlook of $437 million to $440 million suggests they are managing this inflationary pressure effectively.
| Raw Material Input | 2025 Tariff/Price Impact | Effective Date (2025) |
|---|---|---|
| Semi-Finished Copper Products | 50% Section 232 Tariff | August 1, 2025 |
| Steel and Aluminum | 25% Tariff Increase | Early 2025 |
| Copper Price Surge (Past Year) | +38% Price Increase | As of June 2025 |
State-level mandates for lead-free plumbing in schools create a captive market.
Beyond the federal push, state and local governments are creating a permanent, captive market for lead-free fixtures. Many states have passed laws that go beyond federal minimums, mandating lead-free plumbing in schools. For example, some state laws require all water fixtures installed in schools after 2016 to be lead-free and mandate testing for older fixtures. If a fixture tests above a threshold, like 5 parts per billion, it must be replaced or taken out of use for drinking.
This is a regulatory moat for Zurn Elkay, whose Elkay brand is a leader in filtered bottle-filling stations and lead-free drinking solutions. State-level mandates ensure that even if federal funding slows after the BIL's dedicated lead money ends in FY 2026, the replacement cycle for internal school plumbing and fixtures will continue, driven by local law and public health concerns. This provides a durable, non-cyclical demand floor for the company's specialized products.
Zurn Elkay Water Solutions Corporation (ZWS) - PESTLE Analysis: Economic factors
High interest rates slow new commercial and institutional construction starts.
The macroeconomic environment in late 2025 is still constrained by the high cost of capital, despite recent easing by the Federal Reserve. You need to remember that commercial and institutional projects are highly sensitive to borrowing costs, and the current rates are defintely a headwind for new starts.
As of November 2025, the Federal Funds Rate target range sits at 3.75%-4.00%, following consecutive cuts in September and October. While this is down from the peak, it keeps the Bank Prime Loan rate at a high 7.00%, which directly impacts the cost of financing large-scale construction loans. This high-rate environment causes developers to delay or cancel projects, directly slowing the pipeline for new Zurn Elkay Water Solutions Corporation (ZWS) products in the new construction segment.
Here's the quick math on project financing: a 7% prime rate makes a $50 million construction loan significantly more expensive than the sub-4% rates seen just a few years ago. That's a tough hurdle for new commercial real estate projects to clear.
Inflationary pressure on materials and labor squeezes gross margins.
The construction sector continues to grapple with persistent inflation, which pressures Zurn Elkay Water Solutions' gross margins even as the company manages to expand its Adjusted EBITDA margin. Overall construction costs are projected to rise between 5% and 7% in 2025, driven by supply chain volatility and labor shortages.
For Zurn Elkay, the key risk is the rising cost of raw materials, particularly copper and brass used in its plumbing and flow control products. The company's management has explicitly highlighted this pressure, noting that expected tariff costs for the full year 2025 have increased to approximately $50 million, up from earlier projections.
To be fair, ZWS has managed this well through pricing discipline and operational efficiencies, as evidenced by the Adjusted EBITDA margin expansion of 120 basis points to a record 26.8% in the third quarter of 2025.
- Material cost inflation: 5%-7% forecast for 2025 construction costs.
- Direct cost impact: $50 million in expected 2025 tariff costs.
- Offsetting factor: Q3 2025 Adjusted EBITDA margin expanded to 26.8%.
Stable Maintenance, Repair, and Operations (MRO) spending provides a resilient revenue base.
The core strength of Zurn Elkay Water Solutions' business model is its high exposure to the stable Maintenance, Repair, and Operations (MRO) and replacement market, which acts as a crucial buffer against cyclical downturns in new construction. MRO spending is non-discretionary-a broken water fountain or a leaking valve in a school or hospital must be fixed immediately, regardless of interest rates.
While the company does not disclose a precise MRO/New Construction split, its focus on specification-driven, non-residential products means a substantial portion of its revenue is tied to this resilient replacement cycle. This stability is a primary reason the company was able to raise its full-year 2025 guidance, projecting core sales growth of approximately 8% and Adjusted EBITDA between $437 million and $440 million.
This MRO-heavy model insulates the company from the volatility facing pure-play new construction suppliers. It's a key factor in their strong free cash flow, which is expected to be greater than $300 million for the full year 2025.
US commercial construction growth is projected to be slow, maybe flat, in 2025.
The outlook for new US commercial construction starts in 2025 is mixed, but the consensus points to modest growth at best, confirming the 'slow' part of the projection. High interest rates and concerns about commercial real estate overcapacity continue to constrain the market.
Analysts are providing a range of forecasts for the non-residential building sector for 2025:
| Source | 2025 Non-Residential/Commercial Construction Forecast | Key Driver/Segment |
|---|---|---|
| Dodge Construction Network | +5.9% (Dollar Volume of Non-residential Starts) | Spurred by hotels, retail, and healthcare. |
| ConstructConnect | +2.4% (Commercial Construction) | Constrained by high interest rates and overcapacity. |
| FMI Consulting | +2.0% (Overall Construction Put-in-Place Spending) | Manufacturing spending remains a strong segment. |
The reality is that while certain segments like manufacturing and data centers are seeing robust growth, the overall commercial market is only expected to grow in the low-to-mid single digits, with some project types essentially flat. This means ZWS's growth will rely heavily on market share gains, new product adoption (like their Elkay drinking water platform), and the reliability of its MRO segment, rather than a broad market tailwind.
Zurn Elkay Water Solutions Corporation (ZWS) - PESTLE Analysis: Social factors
Increased public awareness of safe drinking water drives demand for filtration and lead-free solutions.
You are seeing a clear, sustained shift in public behavior where clean water is no longer a given, but a priority. This heightened awareness, driven by news cycles and aging infrastructure, creates inelastic demand for water treatment and lead-free plumbing (plumbing that uses materials like lead-free brass to meet federal safety standards). The North America household water treatment system market is a prime example, valued at an estimated US$3,230 million in 2024 and projected to reach US$6,035 million by 2033, a CAGR of 7.40% over that period.
For Zurn Elkay Water Solutions Corporation, this trend is a core strength. Year-to-date in 2025, the company's systems have delivered 1.2 billion gallons of cleaner, filtered water to customers. Whole-house filtration systems are seeing a 15% year-over-year growth in installations, showing consumers want comprehensive solutions, not just point-of-use fixes. Frankly, people are willing to pay for peace of mind.
The company is also actively shaping the regulatory landscape, advocating for filter-first legislation in states like Michigan, Wisconsin, and Massachusetts to ensure K-12 students have access to filtered drinking water. This advocacy creates a future specification-driven market for their Elkay Pro Filtration products, which are certified to NSF/ANSI standards and address concerns like PFAS (per- and polyfluoroalkyl substances, or forever chemicals).
Post-pandemic preference for touchless and hygienic fixtures in public and commercial restrooms persists.
The need for better hygiene in public spaces is a lasting social change, not a temporary fad. Commercial building owners and facility managers are consistently prioritizing touchless and sensor-operated fixtures to reduce germ transmission, especially in high-traffic areas like schools, hospitals, and airports. The global commercial plumbing fixture market, which includes these hygienic solutions, is estimated at $15 billion in 2025, with a projected Compound Annual Growth Rate (CAGR) of 6% through 2033.
This is a direct tailwind for Zurn Elkay Water Solutions, given their focus on commercial and institutional markets. The North American Specialty Faucets Market-which encompasses touchless and sensor-based products-held approximately a 28% share in 2024, driven by healthcare and hospitality sectors. The company's 'Touchless Solutions' and Hydro X Power® fixtures are specifically designed to capitalize on this demand, offering both hygiene and water efficiency. You can see the shift in capital expenditure budgets moving toward retrofitting older buildings with these modern, hygienic systems.
Consumer and institutional demand for water-efficient and sustainable products is rising fast.
Sustainability is a powerful social driver that translates directly into product specifications and purchasing decisions. For Zurn Elkay Water Solutions, this is a core competitive advantage: 86% of the company's revenue is derived from products with sustainable attributes, which conserve water or reduce energy. This is not just a marketing claim; it's a financial metric.
Here's the quick math on the impact:
- Year-to-date in 2025, Zurn Elkay Water Solutions' systems saved 16.6 billion gallons of water.
- Replacing old, inefficient toilets with WaterSense-labeled models can save the average family 13,000 gallons of water per year.
- California is implementing new flushing standards starting in 2025, likely restricting commercial toilets to 1.28 gallons per flush (down from 1.6 gallons), mandating efficiency.
The global plumbing fixtures market is a large and growing target, estimated to reach $123.88 billion in 2025. Nearly one-third of consumers rate sustainability as highly important (an average rating of 7.7 out of 10) when choosing home products, showing the consumer mindset is aligned with the regulatory push.
Demographic shifts in US Sunbelt states drive long-term demand for new water infrastructure.
The ongoing migration of people and businesses to the US Sunbelt (stretching from Florida to California) is fundamentally reshaping the need for new water infrastructure. This 'Sun Belt Boom' is driving high population growth, which in turn necessitates substantial expansion of housing, commercial buildings, and the underlying utility systems.
The long-term demand for Zurn Elkay Water Solutions' products is anchored in this construction activity. States like Texas, Florida, and Arizona are seeing the strongest residential repair and remodeling activity, which is a key market for the company's replacement products. What this estimate hides is the strain on existing systems: in Florida, for instance, utility infrastructure struggles to keep pace with demand growing at an average of 3-4% a year. This requires massive capital investment in new water control, drainage, and filtration systems.
The demographic shift creates a compounding need for both new construction and major retrofitting of aging infrastructure, which is a defintely stable, long-term driver for the water solutions sector.
| Social Factor Driver | 2025 Key Metric / Data Point | Implication for Zurn Elkay Water Solutions Corporation |
|---|---|---|
| Safe Drinking Water Demand (Filtration) | North America water treatment market CAGR of 7.40% (2025-2033). | Direct growth in demand for Elkay Pro Filtration and filtered drinking water products. |
| Water-Efficient Products (Sustainability) | 86% of Zurn Elkay Water Solutions' revenue comes from sustainable products. | Strong alignment with customer values and regulatory changes (e.g., California's new 1.28 Gpf toilet standard in 2025). |
| Hygienic/Touchless Fixtures | Global commercial plumbing fixture market estimated at $15 billion in 2025. | Sustained demand for Zurn's sensor-operated and touchless restroom solutions in commercial sectors. |
| US Sunbelt Demographic Shift | Sunbelt population growth projected to increase by 7% or more over the next decade. | Long-term, structural demand for new commercial and residential water infrastructure. |
Zurn Elkay Water Solutions Corporation (ZWS) - PESTLE Analysis: Technological factors
Development of smart water monitoring systems (Internet of Things) for leak detection and usage tracking.
The shift to smart water management, or the Internet of Things (IoT) in plumbing, is defintely a core technological opportunity for Zurn Elkay Water Solutions Corporation. You see this in their product line-up, which includes a suite of connected devices that move beyond simple fixtures to provide actionable data for facility managers. This is a critical pivot because the global Smart Water Management market is growing fast, with IoT expected to lead the technology segment with a commanding 40.0% market share in 2025.
The company's smart products enable remote monitoring of faucets and flush valves, which helps with maintenance efficiency. For example, getting a low-battery alert for a flush valve replaces guesswork with real-time data, cutting down on unnecessary trips and labor costs. Plus, their Smart Backflow Preventers alert users to real-time system pressure and relief valve discharge, which helps prevent catastrophic flooding and water damage. This technology also supports critical water safety measures, like Legionella control, by automating line flushing and providing essential data documentation.
- Monitor faucet/flush valve status remotely.
- Smart Interceptor Monitor reduces unnecessary cleanouts.
- Real-time data prevents costly water damage.
Innovation in advanced lead-free alloys and materials to meet stricter health standards.
The regulatory environment, particularly around lead content in drinking water systems, is pushing material science innovation, and Zurn Elkay is responding with significant investment. The company has a clear focus on sustainable products, with 86% of its revenue derived from products with sustainable attributes in 2025. Here's the quick math: if their projected full-year 2025 net sales are around the $1.7 billion mark (based on Q1/Q2 run rates), that puts sustainable revenue north of $1.46 billion. This isn't just a marketing claim; it's a major revenue driver.
The company is committed to investing a total of $90 million by 2025 in engineering and R&D specifically to enhance the sustainable aspects of their products, which includes the development of advanced lead-free alloys and filtration technology. This R&D spend is crucial for staying ahead of stricter US health standards, like the revised Lead and Copper Rule. For instance, they launched a residential filtered faucet certified to remove contaminants including lead, PFOA/OS, and microplastics, showcasing their commitment to point-of-use filtration innovation.
Digital tools and Building Information Modeling (BIM) simplify product specification and installation.
The digital transformation of the Architecture, Engineering, and Construction (AEC) industry through Building Information Modeling (BIM) is a major technological tailwind. Zurn Elkay Water Solutions Corporation is actively supporting this trend by providing high-quality digital assets. They upgraded their BIM files in late 2024, making them smaller and more powerful for design models.
These upgraded files are more than just 3D models; they are data-rich assets that streamline the entire project lifecycle. This is a huge help for engineers and contractors like you, making product specification easier and reducing errors in the field. The enriched metadata now includes flow rates, electricity usage, and direct links to product pages and installation instructions. This focus on digital tools for the customer experience is vital, especially since the BIM industry is projected to grow by over 13.6% from 2023 to 2032.
| BIM File Enhancement | Impact on AEC Professionals (2025) |
|---|---|
| Smaller File Sizes | Faster model loading and improved software performance. |
| Enriched Metadata (Flow Rates, Power) | Accurate system calculations during the design phase. |
| Links to Installation Instructions | Streamlines field installation and maintenance for contractors. |
Manufacturing automation improves efficiency and helps stabilize production costs.
The Zurn Elkay Business System (ZEBS) is the company's operational backbone, acting as a lean manufacturing framework that drives efficiency and helps stabilize costs against market volatility. This system, which relies heavily on process automation and optimization, has been a clear success story in 2025. You can see the results in their margins: Adjusted EBITDA margins expanded to 26.5% in Q2 2025, a notable increase from 25.3% in the prior year.
This operational discipline is also a key factor in how they manage global supply chain risks. For example, by strategically reducing their China-based material spend, they are projected to avoid between $45 million and $55 million in potential tariff costs in 2025. This kind of cost mitigation is only possible when you have a highly efficient, automated, and flexible manufacturing and supply chain system. Automation also contributes to their sustainability goals, as evidenced by achieving a 23% reduction in energy intensity from their 2021 baseline, surpassing their 2024 target. That's just good business.
Zurn Elkay Water Solutions Corporation (ZWS) - PESTLE Analysis: Legal factors
For a company like Zurn Elkay Water Solutions Corporation (ZWS), the legal landscape is not just a compliance cost; it is a powerful driver of product demand and a critical risk factor. Your strategy must recognize that every new regulation is a mandate for your customers to buy newer, compliant products. The legal environment in 2025 is defined by stringent federal water safety mandates, aggressive state-level conservation codes, and the ever-present threat of product liability litigation.
Strict compliance with the federal Reduction of Lead in Drinking Water Act is mandatory.
The federal Reduction of Lead in Drinking Water Act (RLDWA) is a foundational regulation for Zurn Elkay, whose product portfolio includes filtered drinking water systems and water safety products. The key mandate is clear: all products touching potable water must meet the 'lead free' standard, defined as a weighted average of no more than 0.25% lead content on the wetted surfaces.
The compliance deadline for mandatory third-party certification was September 1, 2023, meaning that in 2025, the market is fully operating under this stringent requirement. Furthermore, the EPA's Lead and Copper Rule Improvements (LCRI), finalized in late 2024, creates a massive, long-term market tailwind. This rule requires approximately 67,000 public water systems to identify and replace all lead service lines within a decade, which drives demand for Zurn Elkay's certified, lead-free connection and control products.
- The 'lead free' standard is a weighted average of 0.25% lead content.
- Mandatory third-party certification has been in effect since September 1, 2023.
- The LCRI mandates the replacement of lead service lines across roughly 67,000 US public water systems.
Evolving state and local building codes push for greater water conservation and efficiency.
Beyond federal mandates, state and local building codes are rapidly evolving, turning water conservation from a voluntary best practice into a legal requirement. This is a significant opportunity for Zurn Elkay, whose business is built on high-efficiency products. For instance, the updated 2025 Plumbing Code in New York City mandates that all new construction and major renovations must install low-flow fixtures.
In California, the energy and water efficiency standards under Title 24 are even more rigorous. These codes generally cap toilet flush volume at 1.28 gallons per flush and showerhead flow rates at 2.0 gallons per minute or less. This regulatory push aligns perfectly with the company's product mix, where 86% of its revenue is already derived from products with sustainable attributes. You are selling the solution the law now requires. It's a great position to be in.
Environmental Protection Agency (EPA) standards on water quality and discharge are non-negotiable.
While the RLDWA focuses on the product's end-use, Zurn Elkay's manufacturing operations are subject to the EPA's Effluent Limitations Guidelines (ELGs) under the Clean Water Act, which govern industrial wastewater discharge. These rules set technology-based standards for the allowable levels of pollutants discharged into surface waters or Publicly Owned Treatment Works (POTWs).
A major focus in 2025 is the regulation of per- and polyfluoroalkyl substances (PFAS), often called 'forever chemicals.' While a proposed rule for PFAS manufacturers was withdrawn in early 2025, the EPA is actively pursuing ELGs for other industrial sectors, including metal finishing, which is highly relevant to plumbing component manufacturing. Non-compliance carries real financial risk, as seen in 2024-2025 enforcement actions against industrial facilities for Clean Water Act violations, with fines totaling hundreds of thousands of dollars in some regions.
Product liability risk remains high with any failure in water safety or quality.
The nature of Zurn Elkay's products-mission-critical components for health and safety-means product liability risk is defintely elevated. Any failure, whether due to a manufacturing defect (a faulty valve) or a design defect (a product that leaches contaminants), can lead to costly litigation. Your financial statements reflect this constant exposure through a dedicated reserve.
As of March 31, 2025, Zurn Elkay reported a 'Risk management' liability balance of $5.4 million, which covers projected losses from product liability claims, general liability, and environmental issues. This is a small but necessary buffer against potential large-scale litigation. The industry has seen major product liability verdicts in 2025, such as the $3 billion punitive damages verdict against Real Water over tainted bottled water, underscoring the extreme financial exposure when a product compromises public health.
Here is a quick look at the key legal-financial metrics for Zurn Elkay:
| Legal/Risk Metric | Value (As of Q1 2025) | Implication |
|---|---|---|
| Risk Management Liability (Current) | $5.4 million | Reserve for product liability, general, and environmental claims. |
| Product Warranty Liability (Current) | $5.2 million | Expected costs for product failures covered under warranty. |
| % Revenue from Sustainable Products | 86% | High alignment with water conservation mandates (e.g., California Title 24). |
| 2025 Full Year Adjusted EBITDA Outlook | $437 million to $440 million | Strong financial health to absorb compliance costs and manage legal risks. |
The legal environment is a double-edged sword: it mandates compliance costs, but it also forces the market to adopt Zurn Elkay's core product line of high-efficiency, safe water solutions.
Zurn Elkay Water Solutions Corporation (ZWS) - PESTLE Analysis: Environmental factors
Corporate pressure to meet aggressive Environmental, Social, and Governance (ESG) reporting targets.
You are seeing the market demand for financial transparency in environmental performance translate directly into Zurn Elkay Water Solutions Corporation's (ZWS) capital allocation. This isn't just compliance; it's a core strategy. The company has a clear, time-bound commitment to invest a total of $90 million by the end of the 2025 fiscal year in engineering and research and development (R&D) specifically to enhance the sustainable aspects of its product portfolio. This is a significant push, considering they had already reached $74 million in this investment category by the end of 2024.
The pressure from investors and rating agencies is real, so ZWS is focused on hitting its operational targets, too. For instance, the company's goal to reduce Nitrogen Oxide (NOx) air emissions intensity per U.S. dollar of operating revenue by 15% by 2025 was actually surpassed in 2024, achieving a 15.8% reduction. That's a strong signal of operational efficiency and a defintely positive data point for any ESG screen.
- ESG performance is now a capital expenditure driver.
Focus on product life cycle assessment and increasing the recyclability of plumbing fixtures.
The core of Zurn Elkay Water Solutions' business model is now built around product sustainability, which mitigates environmental risk and drives revenue. In 2024, the company reported that 86% of its revenue came from products with sustainable attributes, which well exceeded their 2024 target of 75%. This high percentage confirms that their product development is deeply integrated with life cycle thinking, moving beyond simple water conservation to material health and end-of-life considerations.
To help customers quantify this value, ZWS launched a Total Cost of Ownership and Sustainability Calculator in 2024. This tool translates the environmental benefits-like water and energy savings-into a clear financial return, which is exactly what a facility manager or developer needs to justify the higher upfront cost of a sustainable fixture. The Elkay product lines, for example, already feature Health Product Declarations (HPDs) and utilize recycled materials, directly addressing the growing demand for material transparency in green building standards like LEED and the WELL Building Standard.
| Product Sustainability Metric (2024 Performance) | Target / Baseline | 2024 Result |
|---|---|---|
| Revenue from Sustainable Products | 75% by 2024 | 86% (Surpassed) |
| Annual Water Savings (through product use) | 30 billion gallons (Maintain) | 32.5 billion gallons (Surpassed) |
| Single-Use Plastic Bottles Prevented (through filtered products) | 15 billion annually | 19 billion (Surpassed) |
Water scarcity concerns in the Western US drive demand for ZWS's high-efficiency flow control products.
The persistent and worsening drought conditions across the Western US, particularly in states like California and Arizona, create a non-cyclical, structural demand for Zurn Elkay Water Solutions' core products. When water is scarce, mandated efficiency standards tighten, and that's where ZWS excels. Their products saved an impressive 32.5 billion gallons of water for customers in 2024 alone.
This market driver is visible in their operational footprint, too. The company's Water Control & Safety business, which includes brands like Wilkins, operates a facility in Paso Robles, California. This strategic location puts their high-efficiency flow control and backflow prevention devices right in the center of the highest-need region. The demand isn't just for conservation; it's for quality and safety. New products like the Hydro•X flush valve, which uses a self-generating power source, reduce maintenance and operational water waste, making them ideal for commercial buildings facing water restrictions.
Reducing operational carbon footprint is a key driver for supply chain decisions.
The push to decarbonize operations is fundamentally changing how Zurn Elkay Water Solutions manages its supply chain and manufacturing. The company has made significant strides in reducing its Scope 1 and 2 Greenhouse Gas (GHG) emissions intensity, achieving a 38% reduction from its 2021 baseline by 2024, keeping it on track for the ambitious 50% reduction by 2030 goal. This kind of performance is what keeps a company competitive in a carbon-constrained world.
The supply chain is where the next major hurdle lies, and ZWS is addressing it by enhancing its supplier sustainability program through screenings and audits. On the energy front, they are working toward sourcing at least 25% of their electricity from renewable sources by 2030, having reached 18% in 2024. For example, the solar array at their Paso Robles facility generated over 785,000 kWh of electricity in 2024, which is a concrete step to lower their reliance on grid power. This focus on renewable energy procurement is a direct cost-saving and risk-mitigation strategy.
- Cut Scope 1 and 2 GHG intensity by 38% since 2021.
- Sourced 18% of electricity from renewables in 2024.
- Supplier screening is now a mandatory part of risk reduction.
Disclaimer
All information, articles, and product details provided on this website are for general informational and educational purposes only. We do not claim any ownership over, nor do we intend to infringe upon, any trademarks, copyrights, logos, brand names, or other intellectual property mentioned or depicted on this site. Such intellectual property remains the property of its respective owners, and any references here are made solely for identification or informational purposes, without implying any affiliation, endorsement, or partnership.
We make no representations or warranties, express or implied, regarding the accuracy, completeness, or suitability of any content or products presented. Nothing on this website should be construed as legal, tax, investment, financial, medical, or other professional advice. In addition, no part of this site—including articles or product references—constitutes a solicitation, recommendation, endorsement, advertisement, or offer to buy or sell any securities, franchises, or other financial instruments, particularly in jurisdictions where such activity would be unlawful.
All content is of a general nature and may not address the specific circumstances of any individual or entity. It is not a substitute for professional advice or services. Any actions you take based on the information provided here are strictly at your own risk. You accept full responsibility for any decisions or outcomes arising from your use of this website and agree to release us from any liability in connection with your use of, or reliance upon, the content or products found herein.