
|
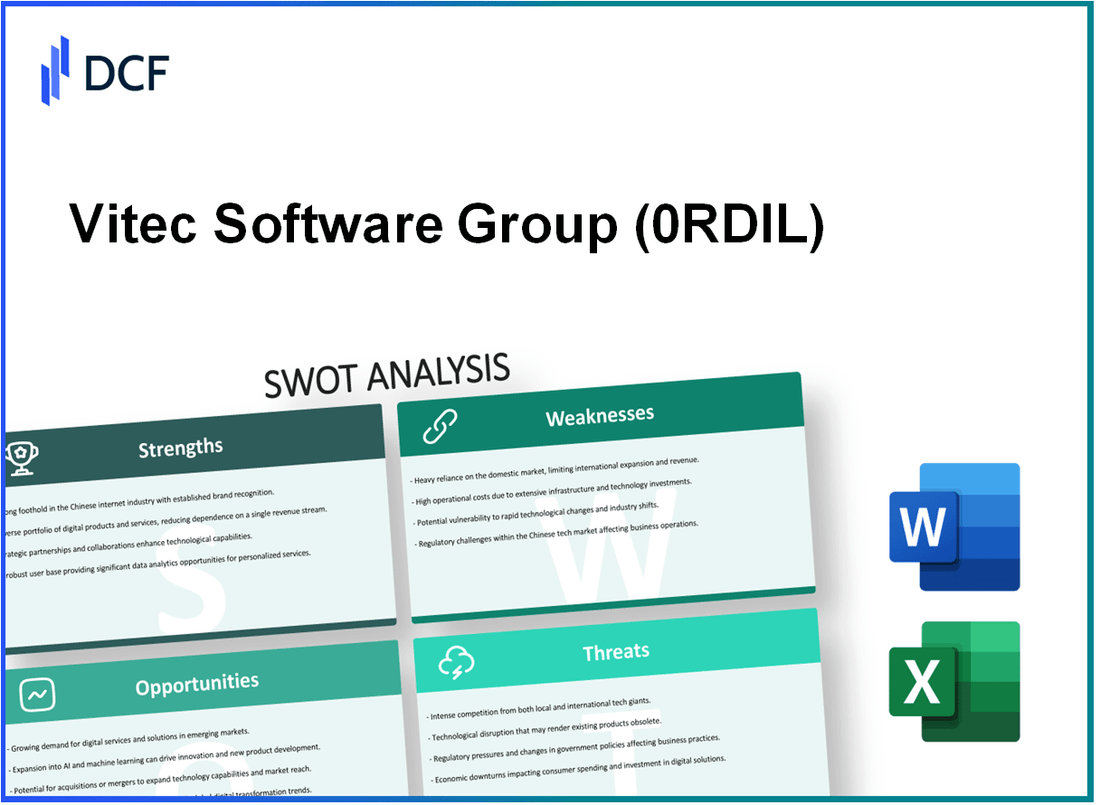
Vitec Software Group AB (0RDI.L): SWOT Analysis [Apr-2026 Updated] |
Totalmente Editável: Adapte-Se Às Suas Necessidades No Excel Ou Planilhas
Design Profissional: Modelos Confiáveis E Padrão Da Indústria
Pré-Construídos Para Uso Rápido E Eficiente
Compatível com MAC/PC, totalmente desbloqueado
Não É Necessária Experiência; Fácil De Seguir
Vitec Software Group AB (publ) (0RDI.L) Bundle
Vitec stands out as a cash-generative, niche-software consolidator with 90% recurring revenues, disciplined M&A firepower and deep vertical embeds that create high customer stickiness - yet its near-term story is complicated by margin pressure, EPS dilution and volatile transaction revenues (notably in energy) against premium valuation multiples. The company's strengths - strong liquidity, a proven acquisition playbook and early AI adoption - give it a runway to expand into cheaper European markets and lift margins by migrating targets to the "Vitec way," but macro slowdowns, rising competition for deals, lower inflation-driven pricing power and rapid tech change pose real risks to execution. Read on to see how Vitec can translate financial strength and sector expertise into sustainable growth while navigating these operational and market headwinds.
Vitec Software Group AB (0RDI.L) - SWOT Analysis: Strengths
High recurring revenue levels ensure financial stability and predictability for the group. As of Q3 2025, recurring revenues accounted for 90% of total net sales, up from 88% in Q3 2024. For the first nine months of 2025, total recurring revenue reached SEK 2,373 million, a 13% year‑over‑year increase. The ten largest software customers represent approximately 8% of total sales, and the single largest customer contributes 1.4% of revenue, indicating low customer concentration and a highly diversified client base.
| Metric | Value (2025 YTD / Q3) | YoY Change |
|---|---|---|
| Recurring revenue share of net sales | 90% | +2 pp vs Q3 2024 |
| Recurring revenue (first 9 months) | SEK 2,373 million | +13% |
| Top 10 customers share | ~8% | - |
| Largest single customer | 1.4% | - |
Robust cash flow generation facilitates continuous reinvestment and a disciplined acquisition strategy. Cash flow from operating activities for the first nine months of 2025 rose to SEK 1,000 million versus SEK 939 million in the prior year. The group's internal profit measure, Cash EBIT, increased by 10% in Q3 2025 to SEK 212 million. Net debt to EBITDA stood at approximately 1.7x as of late 2025, and available credit lines exceed SEK 1.5 billion to support M&A without overleveraging.
| Liquidity / Cash Metrics | Amount | Notes |
|---|---|---|
| Cash flow from operations (9M 2025) | SEK 1,000 million | Up from SEK 939 million (9M 2024) |
| Cash EBIT (Q3 2025) | SEK 212 million | +10% YoY |
| Net debt / EBITDA | ~1.7x | Late 2025 |
| Available credit lines | > SE K 1.5 billion | For acquisitions / liquidity |
Strategic market leadership in niche vertical software provides a strong competitive moat. Vitec operates 46 business units across 12 countries, delivering mission‑critical, deeply integrated solutions with high switching costs and low churn. The company expanded into Poland in 2025 via the acquisition of NMG and has completed 60 acquisitions since 2003. The decentralized model preserves unit expertise while leveraging group resources and financial strength.
- Business units: 46
- Countries: 12
- Total acquisitions since 2003: 60
- 2025 geographic expansion: Entry into Poland (NMG acquisition)
Consistent organic growth in core subscription services drives long‑term value creation. Organic growth in subscription‑based recurring revenues was 6% in Q3 2025. Pricing measures (CPI‑linked) contributed ~3% to organic growth during fiscal 2025. AI integration across 46 business units has improved operational efficiency and supports margin expansion initiatives.
| Growth / Product Metrics | Value | Comment |
|---|---|---|
| Organic subscription revenue growth (Q3 2025) | 6% | Driven by upsell, innovation, pricing |
| Pricing contribution to organic growth (2025) | ~3% | CPI‑linked adjustments |
| Business units using AI | 46 | Efficiency and product enhancements |
Disciplined acquisition model focuses on high‑quality, profitable software companies with proprietary products and a 'permanent home' integration philosophy. In H1 2025, Vitec acquired Intergrip to strengthen its position in the Dutch education software market. The group maintains an active pipeline of 1,000-2,000 potential VMS targets in the Nordics and the Netherlands. Historically, Vitec grew net sales at a CAGR of ~19% from 2011-2024, evidencing consistent consolidation success.
- Recent acquisition (H1 2025): Intergrip (Dutch education software)
- Active M&A pipeline: 1,000-2,000 targets
- Net sales CAGR (2011-2024): ~19%
- Acquisition philosophy: Maintain operational independence; accretive additions
Vitec Software Group AB (0RDI.L) - SWOT Analysis: Weaknesses
Volatility in transaction-based revenue streams negatively impacts overall top-line performance. In Q3 2025, transaction-based recurring revenues contracted by 21% year-over-year, primarily due to weakness in the energy sector. The Dutch business unit Vitec Enova experienced a SEK 50 million revenue decline compared with the exceptional volumes seen in 2024. This volatility stems from the unpredictable nature of the energy balance market, where prices and volumes are determined daily. While these revenues are classified as recurring, they lack the stability of subscription-based models and can cause significant quarterly fluctuations. Organic growth for transaction-based revenues was negative 4% for H1 2025, contrasting sharply with subscription growth which remained positive.
Recent pressure on profit margins reflects shifts in revenue mix and higher operational costs. The EBITA margin for the first nine months of 2025 declined to 26%, down from 30% in the corresponding period of 2024. Operating profit for the nine-month period decreased 3% to SEK 506 million from SEK 520 million. Higher amortization of intangible assets from recent acquisitions has further weighed on reported operating margins, which stood at 19% in Q3 2025. The company's long-term target of an operating profit of at least 20% is challenged by rising personnel expenses and a smaller share of high-margin license and service revenues in a cautious market climate.
Earnings per share have experienced a downward trend due to dilution and increased expenses. For January-September 2025, earnings per share before dilution fell to SEK 7.56, compared to SEK 8.32 in the prior year, a 9% decrease. This decline is attributable to higher financial costs and a directed share issue in late 2024. The issuance of Class B shares raised SEK 1,125 million but resulted in approximately 5.6% dilution for existing shareholders. Net income for the first nine months of 2025 was SEK 300 million, down from SEK 313 million in 2024, indicating bottom-line pressure despite top-line growth.
High valuation multiples compared with industry peers increase the risk of share price volatility. As of December 2025, Vitec trades at a trailing P/E of approximately 30.3x and an EV/EBITA of 21x based on 2025 projections. These premium multiples reflect elevated market expectations for continued aggressive growth through acquisitions. Any slowdown in the M&A pipeline or failure to meet organic growth targets could lead to significant valuation corrections; some institutional portfolios have already recorded a -12% return since initial purchase.
Dependence on a decentralized model may lead to operational inefficiencies or integration challenges. Managing 46 independent business units across 12 countries creates administrative complexity and potential duplication of efforts. While the decentralized approach preserves local expertise, it can hinder rapid implementation of group-wide initiatives or cost-saving measures. Personnel expenses per employee rose to SEK 495,000 in H1 2025, up from SEK 470,000 in the previous year. Failure to effectively share best practices across the diverse portfolio could limit synergy potential.
| Metric | 2024 (YTD / FY) | 2025 (YTD / Q3) | Change |
|---|---|---|---|
| Transaction-based recurring revenue growth (organic) | - | -4% (H1 2025) | -4 pp |
| Q3 transaction revenue change | Baseline (exceptional 2024 volumes) | -21% YoY (Q3 2025) | -21 pp |
| Vitec Enova revenue impact | High volumes 2024 | -SEK 50 million (Q3 2025 vs 2024) | -SEK 50m |
| EBITA margin (9M) | 30% | 26% | -4 pp |
| Operating profit (9M) | SEK 520 million | SEK 506 million | -SEK 14m (-3%) |
| Operating margin (Q3) | - | 19% (Q3 2025) | - |
| Earnings per share (Jan-Sep) | SEK 8.32 | SEK 7.56 | -9% |
| Net income (Jan-Sep) | SEK 313 million | SEK 300 million | -SEK 13m |
| Share issue proceeds | - | SEK 1,125 million (late 2024) | Raised capital |
| Share dilution from issue | - | ~5.6% | - |
| Valuation multiples (Dec 2025) | - | P/E ~30.3x; EV/EBITA 21x | Premium vs peers |
| Business units / Countries | - | 46 units / 12 countries | Complex structure |
| Personnel cost per employee | SEK 470,000 (H1 2024) | SEK 495,000 (H1 2025) | +SEK 25,000 (+5.3%) |
- Revenue concentration risk: Significant sensitivity to energy-market volumes (notably Vitec Enova).
- Margin pressure drivers: Revenue mix shift, amortization from acquisitions, rising personnel costs.
- Capital structure and EPS dilution: Directed share issue increased financial costs and diluted EPS.
- Valuation risk: High P/E and EV/EBITA expose the share price to negative re-rating if growth disappoints.
- Operational complexity: 46 business units across 12 countries increase integration and scalability challenges.
Vitec Software Group AB (0RDI.L) - SWOT Analysis: Opportunities
Expansion into new geographic markets offers significant long-term growth potential beyond the Nordics. The late-2025 acquisition of NMG marked entry into Poland, a market with lower acquisition multiples and substantial demand for vertical software in energy (notably smart metering and grid analytics). Vitec's footprint in 12 countries and sales activities in over 50 countries provide an operational base for accelerated European expansion. Management estimates >1,000 relevant VMS (vertical market software) targets in the Netherlands and Nordic regions alone that fit Vitec acquisition criteria; combined with markets like Poland and Belgium, the addressable European target universe exceeds several thousand SMB vertical-software firms.
Key geographic expansion metrics:
| Metric | Value |
|---|---|
| Countries with direct presence | 12 |
| Countries with sales activity | 50+ |
| Estimated VMS targets (Netherlands + Nordics) | 1,000+ |
| Recent M&A: Poland (NMG) | Late 2025 |
| Recent M&A: Belgium (Trinergy) | Completed |
Integration of advanced AI technologies can drive operational efficiency, enhance product value and unlock new revenue streams. Vitec has implemented AI models for energy-forecasting in Vitec Energy and automated image-description services in Vitec Megler; these are being piloted as premium add-ons and SaaS modules. Expected internal benefits include automated regulatory reporting, AI-driven customer support agents, predictive churn analytics, and efficiency gains in R&D via automated code generation and testing. AI was a central theme of the 2025 Anniversary Conference, signaling strategic investment and multi-year roadmap commitment.
- Current AI use cases: energy forecasts (Vitec Energy), automated image descriptions (Vitec Megler), regulatory reporting (Vitec Appva)
- Expected operational impacts: reduced service costs by 10-30% in targeted units, faster onboarding, higher ARR per customer via premium AI modules
- Strategic aim: monetize AI as tiered SaaS add-ons and reduce manual support FTEs
Favorable regulatory shifts across industries increase demand for compliant vertical software solutions. Stricter data privacy (GDPR evolutions), environmental reporting mandates, and healthcare/social-welfare compliance requirements elevate the need for standardized, mission-critical systems. Vitec Appva's automated regulatory reporting tool addresses immediate needs in healthcare and social services, while other units can leverage similar offerings into energy, real estate and property management segments. Regulatory demand tends to support higher pricing power and longer contract durations-critical for subscription-based valuation uplift.
Regulatory opportunity indicators:
| Regulatory trend | Implication for Vitec | Commercial impact |
|---|---|---|
| Increased environmental reporting | Product extensions for ESG reporting | Higher ARPU, longer contracts |
| Healthcare compliance mandates | Demand for automated reporting (Appva) | Mission-critical positioning, stickiness |
| Energy-smart metering regulations | Market for forecasting & analytics | New modules, upsell to utilities |
Potential for margin expansion exists through the systematic transition of acquired companies to the 'Vitec way': standardized recurring revenue models, centralized product development, stronger pricing discipline and shared services. Many targets are smaller firms with suboptimal pricing and fragmented cost structures; assimilation can drive higher gross margins and operating leverage. Organic subscription revenue growth running at ~6% annually demonstrates resilience of the recurring model. Vitec's long-term target is to push operating margin above 20% through continued consolidation and efficiency improvements.
- Organic subscription growth: ~6% (latest reported)
- Target operating margin: >20%
- Levers for margin expansion: pricing optimization, shared infra, vendor renegotiation, centralized R&D
Strong financial position supports opportunistic, disciplined M&A in a cautious market. Nine-month operating cash flow of ~SEK 1,000 million and >SEK 1.5 billion in available credit lines enable Vitec to act when attractive targets appear without overpaying. Management maintains a conservative acquisition discipline-targeting 5-7 add-on acquisitions per year-leveraging market cycles when valuation multiples compress. This capital flexibility is a competitive advantage versus competitors constrained by high financing costs or limited balance-sheet capacity.
| Financial capacity metric | Value |
|---|---|
| Nine-month operating cash flow | SEK 1,000 million |
| Available credit lines | SEK 1.5+ billion |
| Annual M&A cadence target | 5-7 companies/year |
| Acquisition discipline | Refuse to overpay; opportunistic in weak valuations |
Vitec Software Group AB (0RDI.L) - SWOT Analysis: Threats
Persistent macroeconomic uncertainty may lead to prolonged restraint in customer investment. The 'wait-and-see' market climate noted in 2025 has already affected transaction-based revenues and the pace of new license sales. Q3 2025 reported total revenue growth of 6% versus some analyst estimates of 16%, indicating muted demand. If high interest rates and global instability continue, customers may delay upgrades or expansions of their existing software suites, reducing new license bookings and slowing upsell velocity. While recurring revenues remain stable (recurring share >70% of revenue), a substantial portion of Vitec's near-term growth depends on upsell and new client acquisition; a prolonged economic slowdown could cap organic growth and pressure expansion targets.
Intense competition for high-quality vertical software acquisitions could drive up multiples and compress deal economics. Increased interest from private equity and strategic industrial buyers in the vertical market software (VMS) model has elevated valuations in core Nordic and Dutch markets. Management has signalled a disciplined approach-avoiding deals where price alone is the driver-which may result in missed acquisition opportunities if multiples outpace Vitec's return thresholds. Expansion into Poland is a strategic response to rising prices in existing markets but introduces execution risk related to unfamiliar legal, tax and competitive environments.
| Item | 2025 Reported | Impact |
|---|---|---|
| Total revenue growth (Q3 2025) | 6% YoY | Lower than consensus (16% est), signals demand softness |
| Recurring revenue share | >70% of group revenue | Provides stability but limits upside from new deals |
| Acquisition premium risk | Market multiples rising (Nordics, Netherlands) | Harder to find accretive targets at historical metrics |
| Geographic diversification | Poland entry 2025 | New market risk and integration costs |
Declining inflation rates may reduce the effect of CPI-linked price increases on organic growth. In 2025, approximately half of the reported 6% organic subscription growth (~3 percentage points) was driven by price adjustments tied to CPI. As inflation across Europe normalises and CPI decreases, the effectiveness of annual price indexations will fall, potentially reducing pricing-related growth contribution to near-zero over time. Management has warned that pricing impact is expected to decrease; without offsetting volume growth, new product monetisation or higher retention-driven upsells, organic revenue growth could decelerate.
- 2025 organic subscription growth: 6% (pricing contribution ~3%)
- Expected downward pressure as CPI stabilises across Europe
- Risk to long-term LTV if price increases replace product-led expansion
Rapid technological change and the rise of cloud-native competitors could erode market share in established verticals. Although Vitec's solutions are often mission-critical, emerging SaaS startups with cloud-native architectures, modern APIs and AI-first tooling can offer faster TCO improvements and quicker time-to-value. In 2025, the net of capitalised development costs and amortisation negatively affected operating profit by SEK -22.7 million, reflecting reinvestment needs. Failure to continuously modernise core products (cloud migrations, microservices, AI capabilities) can increase churn and reduce win rates against newer vendors. The decentralized group structure, while useful for vertical focus, may delay coherent platform-level responses to such technological shifts.
Exposure to volatile energy markets through specific business units creates earnings unpredictability and can materially affect margins. Vitec Enova's performance in 2025 caused a SEK 30 million reduction in gross profit for the group, demonstrating how single-unit exposure to commodity and regulatory volatility can disproportionately affect consolidated results. Enova was one of 46 business units, yet its swing contributed to a reduction in the group's EBITA margin. Continued energy price volatility, changes in grid optimisation incentives, or regulatory shifts could produce further swings in transaction-based income and complicate revenue visibility and investor expectations.
| Unit | 2025 Impact (SEK) | Effect on Group |
|---|---|---|
| Enova (energy unit) | -30,000,000 gross profit | Material reduction to group EBITA margin |
| Capitalised development net effect | -22,700,000 operating profit impact | Higher reinvestment cost; margin pressure |
| Transaction-based revenue sensitivity | Variable by market volatility | Creates forecasting uncertainty |
Disclaimer
All information, articles, and product details provided on this website are for general informational and educational purposes only. We do not claim any ownership over, nor do we intend to infringe upon, any trademarks, copyrights, logos, brand names, or other intellectual property mentioned or depicted on this site. Such intellectual property remains the property of its respective owners, and any references here are made solely for identification or informational purposes, without implying any affiliation, endorsement, or partnership.
We make no representations or warranties, express or implied, regarding the accuracy, completeness, or suitability of any content or products presented. Nothing on this website should be construed as legal, tax, investment, financial, medical, or other professional advice. In addition, no part of this site—including articles or product references—constitutes a solicitation, recommendation, endorsement, advertisement, or offer to buy or sell any securities, franchises, or other financial instruments, particularly in jurisdictions where such activity would be unlawful.
All content is of a general nature and may not address the specific circumstances of any individual or entity. It is not a substitute for professional advice or services. Any actions you take based on the information provided here are strictly at your own risk. You accept full responsibility for any decisions or outcomes arising from your use of this website and agree to release us from any liability in connection with your use of, or reliance upon, the content or products found herein.