
|
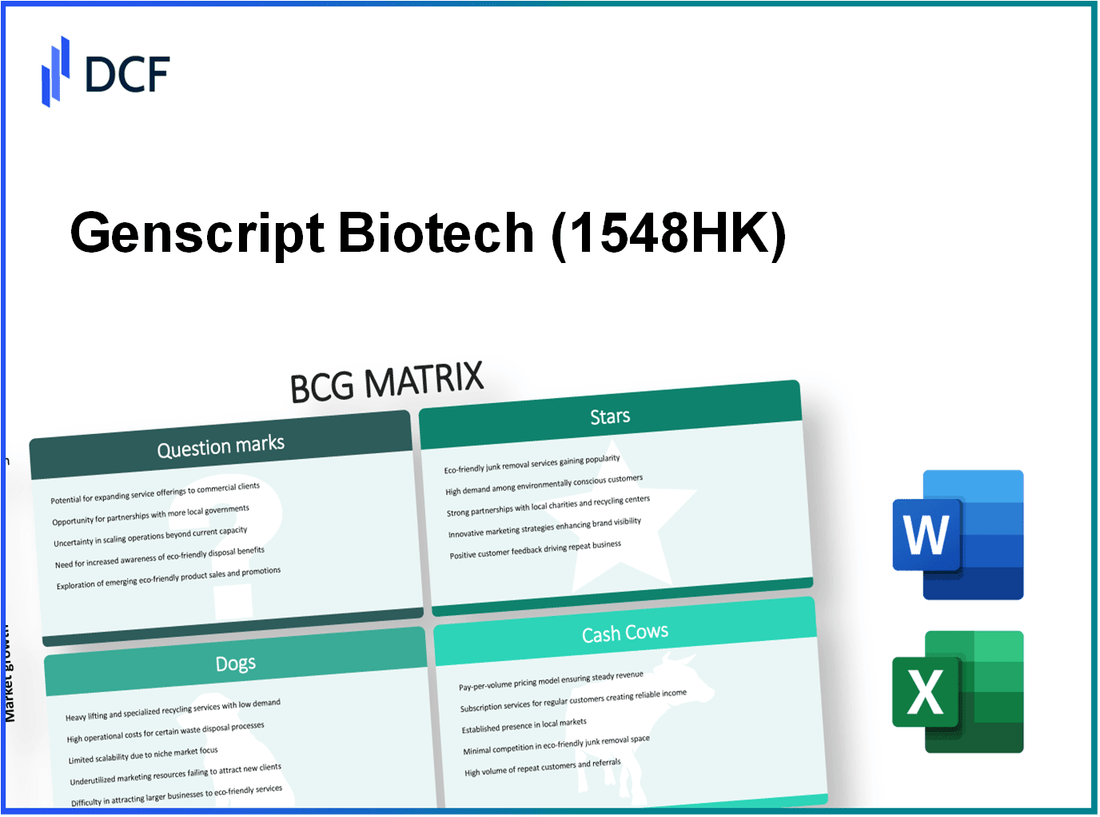
Genscript Biotech Corporation (1548.HK): BCG Matrix [Apr-2026 Updated] |
Totalmente Editável: Adapte-Se Às Suas Necessidades No Excel Ou Planilhas
Design Profissional: Modelos Confiáveis E Padrão Da Indústria
Pré-Construídos Para Uso Rápido E Eficiente
Compatível com MAC/PC, totalmente desbloqueado
Não É Necessária Experiência; Fácil De Seguir
Genscript Biotech Corporation (1548.HK) Bundle
GenScript's portfolio is sharply bifurcated: high-growth "stars" like Legend Biotech (Carvykti) and premium protein/antibody services are driving rapid revenue and commanding major CAPEX (notably $320M for manufacturing and $85M for GMP upgrades), while entrenched cash cows-gene synthesis and catalog consumables-generate strong margins and the free cash that fuels those bets; meanwhile capital-intensive question marks such as ProBio CDMO ($210M expansion) and molecular diagnostics need scale to prove out, and low-share dogs like Bestzyme and legacy reagents are being harvested or wound down-a mix that makes capital allocation the company's strategic heartbeat.
Genscript Biotech Corporation (1548.HK) - BCG Matrix Analysis: Stars
Stars
Legend Biotech leads oncology cell therapy
Legend Biotech's Carvykti (BCMA-directed CAR-T) emerged as a Star within GenScript's portfolio after achieving net trade sales of $1.2 billion in FY2025, representing 60% year-over-year growth as the product expanded into second-line multiple myeloma.
The unit commands a 42% share of the global BCMA CAR-T market and now accounts for 48% of GenScript's consolidated revenue, shifting the company's revenue mix toward high-growth, high-investment therapeutics.
To support volume scale-up and maintain market leadership, Legend allocated $320 million in CAPEX for new or expanded manufacturing facilities in Belgium and the United States. R&D intensity remains elevated at 38% of the unit's revenue to fund indications expansion (notably solid tumors) and pipeline robustness. Operating dynamics show heavy reinvestment with the following indicative metrics:
| Metric | Value |
|---|---|
| FY2025 Net Trade Sales | $1,200,000,000 |
| YoY Growth (FY2024→FY2025) | 60% |
| Global BCMA CAR-T Market Share | 42% |
| Contribution to GenScript Consolidated Revenue | 48% |
| CAPEX Allocated (FY2025) | $320,000,000 |
| R&D Spend (% of Unit Revenue) | 38% |
| Unit Operating Margin (estimated, post-R&D) | 12% (estimated) |
| Estimated Manufacturing Capacity Increase | ~60% combined (Belgium + US expansions) |
Key drivers and strategic priorities for the Legend unit include:
- Expand label into earlier lines of multiple myeloma and additional hematologic malignancies;
- Scale manufacturing footprint to reduce COGS per treatment and secure supply for global commercial demand;
- Advance clinical programs for solid tumor CAR-T indications to protect long-term growth runway;
- Maintain high R&D intensity (38% of revenue) to sustain innovation and competitive differentiation.
Custom protein and antibody services expansion
GenScript's high-end protein and antibody engineering division recorded 22% revenue growth in 2025 driven by increased outsourcing in drug discovery and biologics development. The sub-segment holds an estimated 12% share of the global outsourced protein production market, reflecting a strong niche position in premium, GMP-capable services.
Operational improvements, including automated high-throughput platforms, lifted operating margins to 31%. GenScript invested $85 million to upgrade GMP-grade protein production capacity to meet clinical-stage and commercial contract requirements. The segment delivered an 18% return on investment in 2025 after securing multiple high-value contracts with top global pharmaceutical companies.
| Metric | Value |
|---|---|
| FY2025 Revenue Growth | 22% |
| Estimated Global Outsourced Protein Market Share | 12% |
| Operating Margin (FY2025) | 31% |
| GMP Capacity Upgrade Investment (FY2025) | $85,000,000 |
| Return on Investment (FY2025) | 18% |
| Key Customer Penetration | Contracts with multiple top-20 global pharma companies |
| Average Contract Tenor | 3-5 years (typical) |
| Throughput Improvement from Automation | ~40% faster lead times |
Core strengths and operational focus areas for the custom protein/antibody segment:
- Leverage automated high-throughput platforms to capture high-value discovery and clinical-stage work;
- Expand GMP-compliant capacity to convert discovery-phase clients into long-term clinical and commercial manufacturing partners;
- Target top-tier pharma relationships to stabilize revenue and improve contract margins;
- Continue technology investments to sustain a differentiated 31% operating margin and protect the 12% market share position.
Genscript Biotech Corporation (1548.HK) - BCG Matrix Analysis: Cash Cows
Cash Cows
The life science services and products dominance of GenScript positions key legacy businesses as Cash Cows within the BCG matrix. The core gene synthesis business holds a 30% global market share and generated $440 million in revenue in 2025 with a stable gross margin of 55%. That division produced $135 million in free cash flow (FCF) annually, representing 30.7% FCF-to-revenue conversion for the unit. Market growth for basic gene synthesis is mature at 7% annually, and GenScript's established infrastructure delivers a return on assets (ROA) of 24%. Capital expenditure (CAPEX) needs for this division are minimal, budgeted at $15 million for routine equipment maintenance and minor software upgrades, implying a CAPEX-to-revenue ratio of 3.4%. This business subsidizes higher-risk, higher-capital research initiatives within adjacent divisions, notably Legend Biotech and ProBio, by funding operating and R&D investments without drawing incremental financing.
| Metric | Core Gene Synthesis |
|---|---|
| Global Market Share | 30% |
| Revenue (2025) | $440,000,000 |
| Gross Margin | 55% |
| Free Cash Flow (annual) | $135,000,000 |
| FCF-to-Revenue | 30.7% |
| Market Growth Rate | 7% (mature) |
| Return on Assets (ROA) | 24% |
| CAPEX (annual) | $15,000,000 |
| CAPEX-to-Revenue | 3.4% |
| Role in Portfolio | Primary liquidity source; funds R&D and high-risk units |
The catalog products and reagent consumables line further reinforces the Cash Cow profile. Catalog items-including MagBeads and protein purification resins-account for 15% of the total life science segment revenue and are distributed in over 160 countries with thousands of academic and industrial customers. The catalog segment recorded an organic growth rate of 8% in 2025, aligned with expanding global biotech R&D budgets. Gross margins are high at 68% due to scale manufacturing advantages and product standardization. The capital intensity is low, with a capital intensity ratio of 4% and limited incremental CAPEX required to sustain growth, making the segment a predictable, high-margin cash generator for the group.
| Metric | Catalog Products & Reagents |
|---|---|
| Share of Life Science Segment Revenue | 15% |
| Geographic Presence | 160+ countries |
| Customer Base | Thousands of academic institutions and industry labs |
| Gross Margin | 68% |
| Organic Growth Rate (2025) | 8% |
| Capital Intensity Ratio | 4% |
| Role in Portfolio | Stable, high-margin cash generator |
Combined financial impact of the Cash Cow units creates a robust internal funding engine. Assuming the core gene synthesis ($440M revenue) and catalog/reagents (15% of life science revenue - for example if life science segment revenue is $1,500M then catalog revenue ≈ $225M) together, these units contribute the majority of operating cash generation and margin stability for GenScript. Their low CAPEX and high margins enable sustained support of growth-stage and high-risk divisions without immediate reliance on external capital markets.
- Primary cash generation: Core gene synthesis FCF $135M annually.
- High-margin recurring revenue: Catalog gross margin 68% supports predictability.
- Low reinvestment need: Combined CAPEX-to-revenue under 5% for Cash Cow units.
- Portfolio role: Finance R&D and biotech investments (Legend Biotech, ProBio).
- Stability metrics: ROA 24% (gene synthesis) and organic growth 7-8% in mature markets.
Genscript Biotech Corporation (1548.HK) - BCG Matrix Analysis: Question Marks
Dogs - segments with low relative market share in low-growth markets or businesses at risk of underperformance - are examined here through two units that currently sit at the crossroads between divestiture, continued investment, or repositioning: the GenScript ProBio biologics CDMO growth segment and the Precision Medicine & Molecular Diagnostics unit.
Question Marks - GenScript ProBio biologics CDMO growth
ProBio operates in a biologics CDMO market growing at an estimated 16% annually but the division holds under 4% of the global market. Revenue expanded by 25% in fiscal 2025 to reach $155.0M, yet the unit remains EBIT-negative due to rapid scaling and heavy upfront costs. Total committed CAPEX for 2025 was $210.0M to complete a combined 30,000 L capacity expansion across China and Singapore facilities. Active CMC projects exceed 70, representing a 15% year-over-year increase in project volume. Conversion of early-stage biotech clients into long-term commercial manufacturing partners is the primary driver required to move this unit out of a low-share position.
| Metric | Value |
|---|---|
| Market growth rate | 16% CAGR |
| Estimated global market share | <4% |
| FY2025 revenue | $155.0M |
| Revenue growth (YoY 2025) | +25% |
| EBIT status | Negative |
| CAPEX committed (2025) | $210.0M |
| New capacity | 30,000 L (China + Singapore) |
| Active CMC projects | 70+ |
| Project volume growth (YoY) | +15% |
| Key strategic dependency | Client conversion to commercial manufacturing |
Primary operational and strategic challenges for ProBio include sustaining margin recovery while absorbing capacity-related depreciation and achieving higher utilization to dilute fixed costs. The division must demonstrate pipeline-to-commercial conversion metrics and improve utilization from current ramp-up levels to justify further capital deployment.
- Capacity utilization ramp target: required to approach 60-70% to reach break-even on current CAPEX assumptions.
- Client conversion focus: prioritize projects with clear commercial-scale potential and long-term contracts.
- Margin levers: optimization of downstream processing, yield improvements, and scale efficiencies.
Question Marks - Precision medicine and molecular diagnostics
The molecular diagnostics and synthetic biology-based health screening unit comprises approximately 3% of group revenue and operates in a highly fragmented market where GenScript's market share is estimated at below 1%. Target subsegments such as liquid biopsy and NGS-based testing exhibit forecasted growth near 20% annually, yet current unit margins are compressed at ~18%. Heavy R&D and regulatory investment are required: clinical and validation trial spend totaled $25.0M in 2025. The division remains loss-making on a return-on-investment basis as it struggles to attain scale versus entrenched diagnostic incumbents.
| Metric | Value |
|---|---|
| Contribution to group revenue | 3% |
| Estimated market share (segment) | <1% |
| Target subsegment growth | ~20% CAGR (liquid biopsy, NGS) |
| Unit margin | 18% |
| R&D / clinical spend (2025) | $25.0M |
| Return on investment | Negative |
| Strategic barrier | Regulatory clearance and scale to compete with diagnostic giants |
Key considerations for the diagnostics unit center on whether incremental investment can achieve regulatory approvals and commercial scale quickly enough to reach sustainable margins. The unit must either secure partnerships/licensing with larger diagnostics players, target niche high-margin indications, or accept extended negative returns while pursuing differentiation via proprietary synthetic biology platforms.
- Scale requirement: multi-million-test volume threshold likely necessary to justify fixed costs and distribution investments.
- Regulatory timeline risk: significant cash burn linked to prolonged clinical validation and approval cycles.
- Potential strategic moves: seek OEM/partner agreements, divest non-core assets, or concentrate on B2B licensing for platform technologies.
Genscript Biotech Corporation (1548.HK) - BCG Matrix Analysis: Dogs
Dogs - Bestzyme industrial synthetic biology enzymes and Legacy biochemical reagent distribution are low-growth, low-share businesses within Genscript's portfolio that are generating marginal economic returns and consuming managerial attention disproportionate to their value.
Bestzyme industrial synthetic biology enzymes: This sub-unit contributes ~5% of consolidated revenue, with fiscal-year 2025 revenue of approximately $62 million (group total ≈ $1.24 billion). The industrial enzyme market for animal feed and specialty biocatalysis is mature, exhibiting ~3% yearly growth; Bestzyme's own revenue growth decelerated to +3% in 2025. Relative market share is estimated at ~2% versus global leaders (Novozymes, DSM), reflecting weak competitive positioning. Gross margin for Bestzyme has compressed to ~21% (2025) due to elevated energy/input costs and price pressure from downstream feed producers. Management has capped capital expenditure for this division at $8.0 million for the current planning cycle, signaling a harvest posture rather than investment for share gain. Return on equity (ROE) for the unit is ~2%, well below Genscript's corporate hurdle rate (target ROE ~12-15%).
Legacy biochemical reagent distribution: The commodity reagent distribution channel has become negligible in strategic importance, representing <2% of group revenue (estimated $18-24 million in 2025). Sales volume contracted ~5% year-on-year in 2025 as customers migrate to single-source procurement and lower-cost local distributors. Operating margins have fallen to ~5% and are barely covering fixed administrative and logistics costs. Capital allocation to this area has been reduced to $0 for the current fiscal year as part of an explicit phase-out and product rationalization program.
| Metric | Bestzyme (2025) | Legacy Reagents (2025) |
|---|---|---|
| Revenue ($M) | 62 | 20 |
| % of Group Revenue | ~5% | <2% |
| Revenue Growth (2025) | +3% | -5% |
| Relative Market Share | ~2% | Negligible |
| Gross / Operating Margin | Gross 21% | Operating 5% |
| ROE | 2% | Near breakeven |
| CAPEX (Allocated) | $8.0M (capped) | $0 |
| Strategic Posture | Harvest / maintain cashflow | Phase-out / divest non-core SKUs |
Key operational and financial risks for these Dogs:
- Margin erosion from commodity pricing and energy cost inflation (Bestzyme gross margin compressed to 21%).
- Low capital allocation limiting capability to invest in differentiation or scale production capacity.
- Customer concentration and price sensitivity in animal feed and local reagent markets.
- Opportunity cost of managerial time and working capital that could be redeployed to higher-growth biopharma segments.
Planned management actions and near-term KPIs:
- CAPEX cap enforcement: $8.0M limit for Bestzyme; $0 for reagent distribution.
- Product rationalization: remove low-margin reagent SKUs over 12 months; target inventory reduction of 40%.
- Cost control: reduce fixed logistics/admin overhead by 15% through consolidation of distribution centers.
- Harvest metrics: maintain positive free cash flow from Bestzyme while targeting improvement in margin to 24% via efficiency measures; monitor ROE quarterly with target to approach break-even before further investment.
Financial snapshot (summary metrics for board review): total Dogs revenue ~ $82M (2025), blended margin ~18%, aggregate ROE ~1.5%, allocated CAPEX $8.0M, targeted headcount reduction in distribution 10-20% during phase-out.
Disclaimer
All information, articles, and product details provided on this website are for general informational and educational purposes only. We do not claim any ownership over, nor do we intend to infringe upon, any trademarks, copyrights, logos, brand names, or other intellectual property mentioned or depicted on this site. Such intellectual property remains the property of its respective owners, and any references here are made solely for identification or informational purposes, without implying any affiliation, endorsement, or partnership.
We make no representations or warranties, express or implied, regarding the accuracy, completeness, or suitability of any content or products presented. Nothing on this website should be construed as legal, tax, investment, financial, medical, or other professional advice. In addition, no part of this site—including articles or product references—constitutes a solicitation, recommendation, endorsement, advertisement, or offer to buy or sell any securities, franchises, or other financial instruments, particularly in jurisdictions where such activity would be unlawful.
All content is of a general nature and may not address the specific circumstances of any individual or entity. It is not a substitute for professional advice or services. Any actions you take based on the information provided here are strictly at your own risk. You accept full responsibility for any decisions or outcomes arising from your use of this website and agree to release us from any liability in connection with your use of, or reliance upon, the content or products found herein.