
|
H&K AG (MLHK.PA) DCF Valuation |
Totalmente Editável: Adapte-Se Às Suas Necessidades No Excel Ou Planilhas
Design Profissional: Modelos Confiáveis E Padrão Da Indústria
Pré-Construídos Para Uso Rápido E Eficiente
Compatível com MAC/PC, totalmente desbloqueado
Não É Necessária Experiência; Fácil De Seguir
H&K AG (MLHK.PA) Bundle
Gain insight into your H&K AG (MLHKPA) valuation analysis using our state-of-the-art DCF Calculator! This Excel template comes preloaded with real MLHKPA data, enabling you to adjust forecasts and assumptions to accurately determine the intrinsic value of H&K AG.
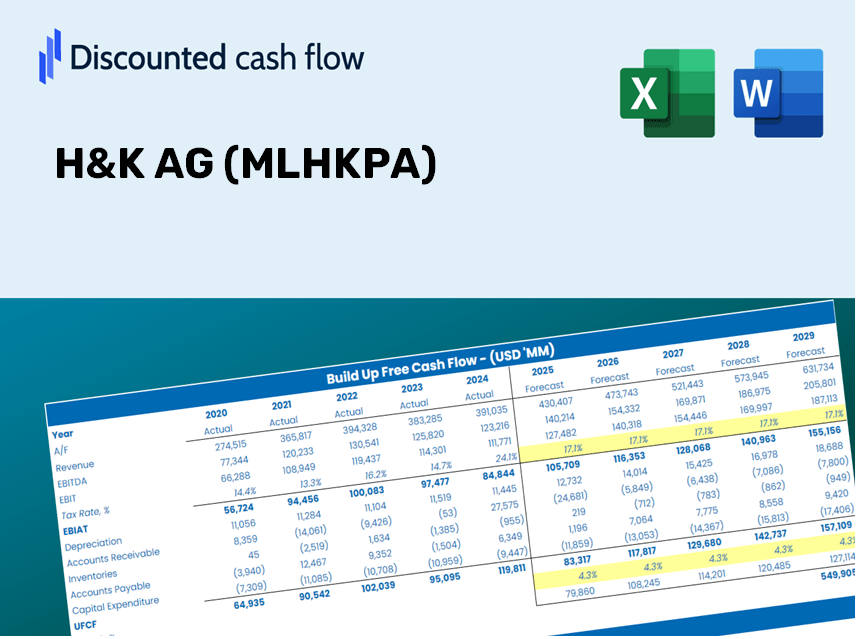
Discounted Cash Flow (DCF) - (USD MM)
| Year | AY1 2020 |
AY2 2021 |
AY3 2022 |
AY4 2023 |
AY5 2024 |
FY1 2025 |
FY2 2026 |
FY3 2027 |
FY4 2028 |
FY5 2029 |
|---|---|---|---|---|---|---|---|---|---|---|
| Revenue | 275.0 | 290.2 | 305.1 | 301.4 | 343.4 | 363.4 | 384.7 | 407.2 | 431.0 | 456.2 |
| Revenue Growth, % | 0 | 5.54 | 5.13 | -1.21 | 13.92 | 5.85 | 5.85 | 5.85 | 5.85 | 5.85 |
| EBITDA | 44.6 | 57.1 | 76.3 | 59.3 | 61.8 | 71.7 | 75.8 | 80.3 | 85.0 | 89.9 |
| EBITDA, % | 16.22 | 19.68 | 25 | 19.67 | 18.01 | 19.72 | 19.72 | 19.72 | 19.72 | 19.72 |
| Depreciation | 11.0 | 11.8 | 11.7 | 11.8 | 13.6 | 14.4 | 15.2 | 16.1 | 17.0 | 18.0 |
| Depreciation, % | 3.98 | 4.05 | 3.84 | 3.92 | 3.96 | 3.95 | 3.95 | 3.95 | 3.95 | 3.95 |
| EBIT | 33.6 | 45.4 | 64.6 | 47.5 | 48.3 | 57.3 | 60.7 | 64.2 | 68.0 | 71.9 |
| EBIT, % | 12.23 | 15.63 | 21.16 | 15.76 | 14.06 | 15.77 | 15.77 | 15.77 | 15.77 | 15.77 |
| Total Cash | -1.2 | 4.4 | 6.4 | 20.6 | 69.6 | 22.0 | 23.3 | 24.7 | 26.1 | 27.6 |
| Total Cash, percent | .0 | .0 | .0 | .0 | .0 | .0 | .0 | .0 | .0 | .0 |
| Account Receivables | 25.2 | 32.2 | 35.2 | 38.9 | 41.7 | 41.3 | 43.7 | 46.3 | 49.0 | 51.8 |
| Account Receivables, % | 9.17 | 11.09 | 11.52 | 12.91 | 12.13 | 11.36 | 11.36 | 11.36 | 11.36 | 11.36 |
| Inventories | 94.5 | 96.7 | 117.6 | 148.2 | 170.3 | 149.0 | 157.7 | 166.9 | 176.7 | 187.0 |
| Inventories, % | 34.36 | 33.31 | 38.54 | 49.17 | 49.6 | 40.99 | 40.99 | 40.99 | 40.99 | 40.99 |
| Accounts Payable | 18.2 | 19.0 | 21.2 | 19.3 | 18.2 | 23.1 | 24.5 | 25.9 | 27.4 | 29.0 |
| Accounts Payable, % | 6.62 | 6.56 | 6.95 | 6.39 | 5.29 | 6.36 | 6.36 | 6.36 | 6.36 | 6.36 |
| Capital Expenditure | -22.8 | -18.9 | -20.0 | -22.4 | -22.1 | -25.6 | -27.1 | -28.7 | -30.4 | -32.1 |
| Capital Expenditure, % | -8.3 | -6.5 | -6.54 | -7.42 | -6.45 | -7.04 | -7.04 | -7.04 | -7.04 | -7.04 |
| Tax Rate, % | 34.65 | 34.65 | 34.65 | 34.65 | 34.65 | 34.65 | 34.65 | 34.65 | 34.65 | 34.65 |
| EBITAT | 22.5 | 31.5 | 61.3 | 23.0 | 31.5 | 39.6 | 41.9 | 44.3 | 46.9 | 49.6 |
| Depreciation | ||||||||||
| Changes in Account Receivables | ||||||||||
| Changes in Inventories | ||||||||||
| Changes in Accounts Payable | ||||||||||
| Capital Expenditure | ||||||||||
| UFCF | -90.9 | 16.1 | 31.3 | -23.9 | -2.9 | 54.9 | 20.2 | 21.4 | 22.6 | 23.9 |
| WACC, % | 4.66 | 4.67 | 4.81 | 4.56 | 4.65 | 4.67 | 4.67 | 4.67 | 4.67 | 4.67 |
| PV UFCF | ||||||||||
| SUM PV UFCF | 127.5 | |||||||||
| Long Term Growth Rate, % | 2.00 | |||||||||
| Free cash flow (T + 1) | 24 | |||||||||
| Terminal Value | 915 | |||||||||
| Present Terminal Value | 728 | |||||||||
| Enterprise Value | 856 | |||||||||
| Net Debt | 31 | |||||||||
| Equity Value | 825 | |||||||||
| Diluted Shares Outstanding, MM | 35 | |||||||||
| Equity Value Per Share | 23.25 |
What You Will Gain
- Real H&K AG Financial Data: Pre-loaded with H&K AG’s historical and projected figures for accurate analysis.
- Completely Customizable Template: Easily adjust key variables such as revenue growth, WACC, and EBITDA percentage.
- Instantaneous Calculations: Observe H&K AG’s intrinsic value change in real-time as you make adjustments.
- Professional Valuation Tool: Tailored for investors, analysts, and consultants aiming for precise DCF outcomes.
- User-Friendly Interface: Clear layout and straightforward instructions suitable for users of all skill levels.
Key Features of H&K AG (MLHKPA)
- Customizable Assumptions: Adjust essential inputs such as revenue growth, EBITDA percentage, and capital expenditures.
- Instant DCF Valuation: Quickly computes intrinsic value, NPV, and various financial metrics.
- High-Precision Results: Leverages H&K AG's real-world financial data for accurate valuation insights.
- Simplified Scenario Analysis: Effortlessly evaluate different scenarios and analyze their outcomes.
- Efficiency Booster: Remove the hassle of creating intricate valuation models from the ground up.
How It Operates
- Step 1: Download the Excel spreadsheet.
- Step 2: Review the pre-filled H&K AG (MLHKPA) data (both historical and forecasted).
- Step 3: Modify key assumptions (highlighted in yellow) according to your analysis.
- Step 4: Observe automatic updates for H&K AG's (MLHKPA) intrinsic value.
- Step 5: Utilize the results for investment decisions or reporting purposes.
Why Opt for the H&K AG (MLHKPA) Calculator?
- Reliable Data: Access accurate H&K AG financial information for dependable valuation outcomes.
- Personalizable: Tailor essential metrics such as growth rates, WACC, and tax rates to fit your forecasts.
- Efficient: Built-in calculations allow you to save time and avoid starting from scratch.
- High-Caliber Tool: Crafted for investors, analysts, and consultants alike.
- Easy to Use: User-friendly design and step-by-step guidance ensure accessibility for everyone.
Who Can Benefit from H&K AG (MLHKPA)?
- Institutional Investors: Create comprehensive and dependable valuation models for investment analysis.
- Finance Departments: Evaluate valuation scenarios to inform corporate strategies.
- Advisors and Consultants: Deliver precise valuation insights for H&K AG (MLHKPA) to clients.
- Students and Educators: Utilize real-world data to learn and teach financial modeling techniques.
- Industry Enthusiasts: Gain insights into how companies like H&K AG (MLHKPA) are assessed in the marketplace.
What the Template Includes
- Pre-Filled DCF Model: H&K AG’s financial data preloaded for immediate application.
- WACC Calculator: Comprehensive calculations for Weighted Average Cost of Capital.
- Financial Ratios: Assess H&K AG’s profitability, leverage, and operational efficiency.
- Editable Inputs: Modify assumptions such as growth rates, profit margins, and CAPEX to align with your scenarios.
- Financial Statements: Annual and quarterly reports provided for in-depth analysis.
- Interactive Dashboard: Effortlessly visualize essential valuation metrics and outcomes.
Disclaimer
All information, articles, and product details provided on this website are for general informational and educational purposes only. We do not claim any ownership over, nor do we intend to infringe upon, any trademarks, copyrights, logos, brand names, or other intellectual property mentioned or depicted on this site. Such intellectual property remains the property of its respective owners, and any references here are made solely for identification or informational purposes, without implying any affiliation, endorsement, or partnership.
We make no representations or warranties, express or implied, regarding the accuracy, completeness, or suitability of any content or products presented. Nothing on this website should be construed as legal, tax, investment, financial, medical, or other professional advice. In addition, no part of this site—including articles or product references—constitutes a solicitation, recommendation, endorsement, advertisement, or offer to buy or sell any securities, franchises, or other financial instruments, particularly in jurisdictions where such activity would be unlawful.
All content is of a general nature and may not address the specific circumstances of any individual or entity. It is not a substitute for professional advice or services. Any actions you take based on the information provided here are strictly at your own risk. You accept full responsibility for any decisions or outcomes arising from your use of this website and agree to release us from any liability in connection with your use of, or reliance upon, the content or products found herein.