
|
Nanfang Black Sesame Group Co.، Ltd. (000716.SZ) تقييم DCF |
Fully Editable: Tailor To Your Needs In Excel Or Sheets
Professional Design: Trusted, Industry-Standard Templates
Investor-Approved Valuation Models
MAC/PC Compatible, Fully Unlocked
No Expertise Is Needed; Easy To Follow
Nanfang Black Sesame Group Co., Ltd. (000716.SZ) Bundle
Engineered for accuracy, our (000716SZ) DCF Calculator enables you to assess the valuation of Nanfang Black Sesame Group Co., Ltd. with comprehensive financial data and complete flexibility to modify all essential variables for enhanced projections.
Benefits You Will Receive
- Genuine 000716SZ Financial Data: Fully loaded with Nanfang Black Sesame Group's historical and projected financial information for accurate analysis.
- Completely Customizable Template: Effortlessly adjust essential inputs like revenue growth, WACC, and EBITDA percentage.
- Instant Calculations: Watch as the intrinsic value for 000716SZ updates in real-time with your modifications.
- Expert Valuation Tool: Tailored for investors, analysts, and consultants aiming for precise DCF outcomes.
- Intuitive Design: Straightforward layout and clear guidance suitable for users of all experience levels.
Key Features
- Real-Life 000716SZ Data: Pre-filled with Nanfang Black Sesame Group’s historical financials and forward-looking projections.
- Fully Customizable Inputs: Modify revenue growth, profit margins, WACC, tax rates, and capital expenditures to suit your analysis.
- Dynamic Valuation Model: Automatic recalculations of Net Present Value (NPV) and intrinsic value based on user-defined parameters.
- Scenario Testing: Develop multiple forecasting scenarios to evaluate various valuation outcomes.
- User-Friendly Design: Intuitive and structured interface catered to both professionals and beginners.
How It Works
- Download the Template: Gain instant access to the Excel-based Nanfang Black Sesame DCF Calculator.
- Input Your Assumptions: Modify the yellow-highlighted cells to reflect growth rates, WACC, margins, and additional parameters.
- Instant Calculations: The model automatically recalculates the intrinsic value of Nanfang Black Sesame Group (000716SZ).
- Test Scenarios: Explore various assumptions to see how they impact potential valuations.
- Analyze and Decide: Leverage the outcomes to inform your investment and financial analysis decisions.
Why Choose This Calculator for Nanfang Black Sesame Group Co., Ltd. (000716SZ)?
- Reliable Data: Use authentic financials from Nanfang Black Sesame Group for accurate valuations.
- Tailorable Options: Modify essential parameters such as growth rates, WACC, and tax rates to align with your forecasts.
- Efficiency Boost: Ready-to-use calculations save you the hassle of starting from square one.
- Professional Quality: Crafted for the needs of investors, analysts, and consultants.
- Easy to Use: A user-friendly interface with clear, step-by-step guidance for all experience levels.
Who Can Benefit from This Product?
- Institutional Investors: Develop comprehensive and reliable valuation models for analyzing portfolios related to Nanfang Black Sesame Group Co., Ltd. (000716SZ).
- Corporate Finance Departments: Evaluate valuation scenarios to inform strategic decisions within the organization.
- Consultants and Financial Advisors: Deliver precise valuation insights to clients focused on Nanfang Black Sesame Group Co., Ltd. (000716SZ).
- Students and Academics: Utilize real-world data to enhance learning and practice in financial modeling.
- Industry Enthusiasts: Gain insights into the market valuation of companies like Nanfang Black Sesame Group Co., Ltd. (000716SZ).
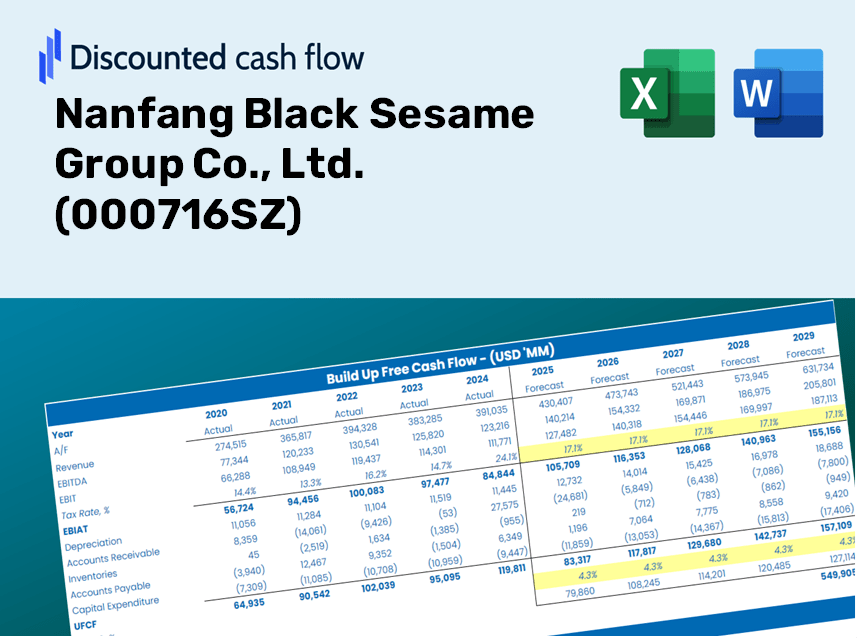
What the Template Contains
- Preloaded Nanfang Black Sesame Data: Historical and projected financial information, including revenue, EBIT, and capital expenditures.
- DCF and WACC Models: Advanced worksheets for calculating intrinsic value and Weighted Average Cost of Capital.
- Editable Inputs: Yellow-highlighted cells for customizing revenue growth, tax rates, and discount rates.
- Financial Statements: Detailed annual and quarterly financials for in-depth analysis.
- Key Ratios: Profitability, leverage, and efficiency ratios for performance assessment.
- Dashboard and Charts: Visual summaries presenting valuation results and underlying assumptions.
Disclaimer
All information, articles, and product details provided on this website are for general informational and educational purposes only. We do not claim any ownership over, nor do we intend to infringe upon, any trademarks, copyrights, logos, brand names, or other intellectual property mentioned or depicted on this site. Such intellectual property remains the property of its respective owners, and any references here are made solely for identification or informational purposes, without implying any affiliation, endorsement, or partnership.
We make no representations or warranties, express or implied, regarding the accuracy, completeness, or suitability of any content or products presented. Nothing on this website should be construed as legal, tax, investment, financial, medical, or other professional advice. In addition, no part of this site—including articles or product references—constitutes a solicitation, recommendation, endorsement, advertisement, or offer to buy or sell any securities, franchises, or other financial instruments, particularly in jurisdictions where such activity would be unlawful.
All content is of a general nature and may not address the specific circumstances of any individual or entity. It is not a substitute for professional advice or services. Any actions you take based on the information provided here are strictly at your own risk. You accept full responsibility for any decisions or outcomes arising from your use of this website and agree to release us from any liability in connection with your use of, or reliance upon, the content or products found herein.