
|
Apeloa Pharmaceutical Co. ، Ltd (000739.SZ) تقييم DCF |
Fully Editable: Tailor To Your Needs In Excel Or Sheets
Professional Design: Trusted, Industry-Standard Templates
Investor-Approved Valuation Models
MAC/PC Compatible, Fully Unlocked
No Expertise Is Needed; Easy To Follow
Apeloa Pharmaceutical Co.,Ltd (000739.SZ) Bundle
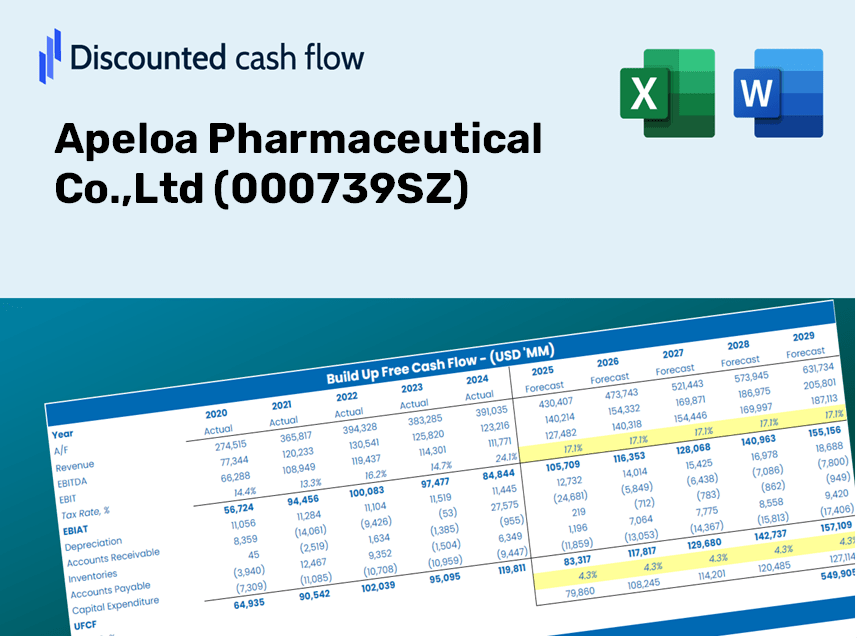
Evaluate the financial prospects of Apeloa Pharmaceutical Co., Ltd like an expert! This (000739SZ) DCF Calculator provides pre-filled financial data along with comprehensive flexibility to modify revenue growth, WACC, margins, and other crucial assumptions to align with your predictions.
What You Will Receive
- Authentic Apeloa Data: Preloaded financial metrics – from revenue to EBIT – based on actual and forecasted figures.
- Complete Customization: Modify all essential parameters (yellow cells) such as WACC, growth %, and tax rates.
- Immediate Valuation Updates: Automatic recalculations to evaluate the effects of changes on Apeloa's fair value.
- Flexible Excel Template: Designed for quick modifications, scenario analysis, and comprehensive projections.
- Efficient and Precise: Avoid building models from the ground up while ensuring accuracy and adaptability.
Highlighted Features
- Comprehensive DCF Calculator: Offers detailed unlevered and levered DCF valuation models tailored for Apeloa Pharmaceutical Co., Ltd (000739SZ).
- WACC Analysis Tool: Pre-configured Weighted Average Cost of Capital sheet with adjustable parameters.
- Customizable Forecast Parameters: Adjust growth rates, capital expenditures, and discount rates to suit your needs.
- Integrated Financial Ratios: Evaluate profitability, leverage, and efficiency ratios specifically for Apeloa Pharmaceutical Co., Ltd (000739SZ).
- Interactive Dashboard and Charts: Visual representations of key valuation metrics for streamlined analysis.
How It Works
- Step 1: Download the prebuilt Excel template featuring Apeloa Pharmaceutical Co., Ltd's (000739SZ) data.
- Step 2: Navigate through the pre-filled sheets to familiarize yourself with the essential metrics.
- Step 3: Modify forecasts and assumptions in the editable yellow cells (WACC, growth, margins).
- Step 4: Immediately see the updated results, including Apeloa's intrinsic value.
- Step 5: Utilize the outputs to make informed investment choices or create detailed reports.
Why Opt for This Calculator?
- All-in-One Solution: Combines DCF, WACC, and financial ratio analyses tailored for Apeloa Pharmaceutical Co.,Ltd (000739SZ).
- Flexible Inputs: Modify the yellow-highlighted cells to explore different financial scenarios.
- In-Depth Analysis: Automatically computes Apeloa's intrinsic value and Net Present Value.
- Built-in Data: Historical and projected data provide reliable starting points for analysis.
- High Standard: Perfect for financial analysts, investors, and business advisors focused on Apeloa Pharmaceutical Co.,Ltd (000739SZ).
Who Can Benefit from This Product?
- Investors: Evaluate Apeloa Pharmaceutical Co., Ltd's (000739SZ) valuation prior to making investment decisions.
- CFOs and Financial Analysts: Optimize valuation methodologies and assess forecasts for accuracy.
- Startup Founders: Gain insights into how established companies like Apeloa Pharmaceutical Co., Ltd (000739SZ) are appraised.
- Consultants: Provide comprehensive valuation reports to enhance client offerings.
- Students and Educators: Utilize real-time data to learn and teach valuation strategies effectively.
Contents of the Template
- Historical Data: Provides Apeloa Pharmaceutical's past financial performance and foundational forecasts.
- DCF and Levered DCF Models: Comprehensive templates designed to assess Apeloa Pharmaceutical's intrinsic value.
- WACC Sheet: Pre-configured calculations for the Weighted Average Cost of Capital.
- Editable Inputs: Adjust critical parameters such as growth rates, EBITDA percentages, and CAPEX assumptions.
- Quarterly and Annual Statements: A thorough overview of Apeloa Pharmaceutical's financial data.
- Interactive Dashboard: Dynamically visualize valuation outcomes and projections.
Disclaimer
All information, articles, and product details provided on this website are for general informational and educational purposes only. We do not claim any ownership over, nor do we intend to infringe upon, any trademarks, copyrights, logos, brand names, or other intellectual property mentioned or depicted on this site. Such intellectual property remains the property of its respective owners, and any references here are made solely for identification or informational purposes, without implying any affiliation, endorsement, or partnership.
We make no representations or warranties, express or implied, regarding the accuracy, completeness, or suitability of any content or products presented. Nothing on this website should be construed as legal, tax, investment, financial, medical, or other professional advice. In addition, no part of this site—including articles or product references—constitutes a solicitation, recommendation, endorsement, advertisement, or offer to buy or sell any securities, franchises, or other financial instruments, particularly in jurisdictions where such activity would be unlawful.
All content is of a general nature and may not address the specific circumstances of any individual or entity. It is not a substitute for professional advice or services. Any actions you take based on the information provided here are strictly at your own risk. You accept full responsibility for any decisions or outcomes arising from your use of this website and agree to release us from any liability in connection with your use of, or reliance upon, the content or products found herein.