
|
شركة New Hope Liuhe Co.، Ltd. (000876.SZ) تقييم DCF |
Fully Editable: Tailor To Your Needs In Excel Or Sheets
Professional Design: Trusted, Industry-Standard Templates
Investor-Approved Valuation Models
MAC/PC Compatible, Fully Unlocked
No Expertise Is Needed; Easy To Follow
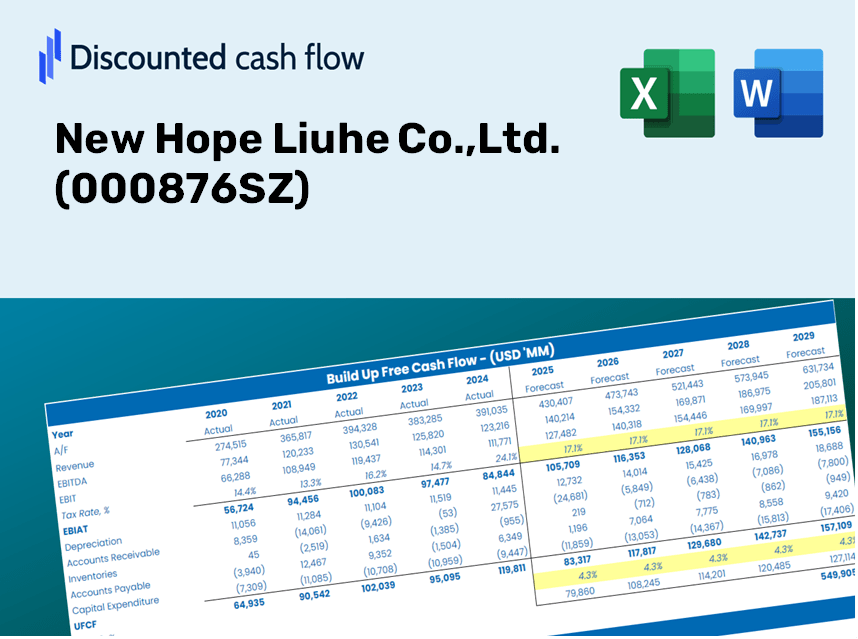
New Hope Liuhe Co.,Ltd. (000876.SZ) Bundle
Assess the financial outlook of New Hope Liuhe Co., Ltd. like an expert! This (000876SZ) DCF Calculator provides you with pre-filled financial data and complete flexibility to modify revenue growth, WACC, margins, and other critical assumptions to align with your projections.
Discounted Cash Flow (DCF) - (USD MM)
| Year | AY1 2020 |
AY2 2021 |
AY3 2022 |
AY4 2023 |
AY5 2024 |
FY1 2025 |
FY2 2026 |
FY3 2027 |
FY4 2028 |
FY5 2029 |
|---|---|---|---|---|---|---|---|---|---|---|
| Revenue | 109,825.2 | 126,261.7 | 141,507.7 | 141,703.2 | 103,063.0 | 103,040.0 | 103,016.9 | 102,993.9 | 102,970.9 | 102,948.0 |
| Revenue Growth, % | 0 | 14.97 | 12.07 | 0.13817 | -27.27 | -0.02232819 | -0.02232819 | -0.02232819 | -0.02232819 | -0.02232819 |
| EBITDA | 9,082.6 | -2,152.6 | 5,029.6 | -442.9 | 4,519.2 | 2,924.6 | 2,924.0 | 2,923.3 | 2,922.7 | 2,922.0 |
| EBITDA, % | 8.27 | -1.7 | 3.55 | -0.31254 | 4.38 | 2.84 | 2.84 | 2.84 | 2.84 | 2.84 |
| Depreciation | 2,929.1 | 5,225.4 | 4,649.7 | 4,060.2 | 3,268.0 | 3,323.6 | 3,322.8 | 3,322.1 | 3,321.3 | 3,320.6 |
| Depreciation, % | 2.67 | 4.14 | 3.29 | 2.87 | 3.17 | 3.23 | 3.23 | 3.23 | 3.23 | 3.23 |
| EBIT | 6,153.5 | -7,378.0 | 379.9 | -4,503.1 | 1,251.2 | -398.9 | -398.9 | -398.8 | -398.7 | -398.6 |
| EBIT, % | 5.6 | -5.84 | 0.26845 | -3.18 | 1.21 | -0.38717 | -0.38717 | -0.38717 | -0.38717 | -0.38717 |
| Total Cash | 8,801.5 | 14,889.6 | 11,661.3 | 10,858.3 | 8,703.3 | 9,099.4 | 9,097.4 | 9,095.4 | 9,093.3 | 9,091.3 |
| Total Cash, percent | .0 | .0 | .0 | .0 | .0 | .0 | .0 | .0 | .0 | .0 |
| Account Receivables | 1,300.3 | 1,684.7 | 3,010.9 | 5,475.8 | 2,101.4 | 2,174.0 | 2,173.5 | 2,173.0 | 2,172.5 | 2,172.0 |
| Account Receivables, % | 1.18 | 1.33 | 2.13 | 3.86 | 2.04 | 2.11 | 2.11 | 2.11 | 2.11 | 2.11 |
| Inventories | 15,649.7 | 15,925.6 | 17,901.1 | 13,315.7 | 10,732.2 | 12,225.3 | 12,222.6 | 12,219.9 | 12,217.1 | 12,214.4 |
| Inventories, % | 14.25 | 12.61 | 12.65 | 9.4 | 10.41 | 11.86 | 11.86 | 11.86 | 11.86 | 11.86 |
| Accounts Payable | 10,099.6 | 9,585.8 | 14,297.6 | 16,631.7 | 11,709.5 | 10,302.0 | 10,299.7 | 10,297.4 | 10,295.1 | 10,292.8 |
| Accounts Payable, % | 9.2 | 7.59 | 10.1 | 11.74 | 11.36 | 10 | 10 | 10 | 10 | 10 |
| Capital Expenditure | -34,250.1 | -17,446.0 | -6,853.4 | -3,624.7 | -2,184.1 | -11,236.2 | -11,233.7 | -11,231.2 | -11,228.7 | -11,226.2 |
| Capital Expenditure, % | -31.19 | -13.82 | -4.84 | -2.56 | -2.12 | -10.9 | -10.9 | -10.9 | -10.9 | -10.9 |
| Tax Rate, % | 2.04 | 2.04 | 2.04 | 2.04 | 2.04 | 2.04 | 2.04 | 2.04 | 2.04 | 2.04 |
| EBITAT | 4,935.6 | -7,784.0 | 315.2 | 1,645.8 | 1,225.6 | -288.1 | -288.1 | -288.0 | -287.9 | -287.9 |
| Depreciation | ||||||||||
| Changes in Account Receivables | ||||||||||
| Changes in Inventories | ||||||||||
| Changes in Accounts Payable | ||||||||||
| Capital Expenditure | ||||||||||
| UFCF | -33,235.8 | -21,178.5 | -478.5 | 6,535.9 | 3,345.3 | -11,174.0 | -8,198.0 | -8,196.2 | -8,194.4 | -8,192.5 |
| WACC, % | 4.34 | 4.77 | 4.4 | 2.58 | 4.73 | 4.16 | 4.16 | 4.16 | 4.16 | 4.16 |
| PV UFCF | ||||||||||
| SUM PV UFCF | -39,177.0 | |||||||||
| Long Term Growth Rate, % | 3.00 | |||||||||
| Free cash flow (T + 1) | -8,438 | |||||||||
| Terminal Value | -725,229 | |||||||||
| Present Terminal Value | -591,420 | |||||||||
| Enterprise Value | -630,597 | |||||||||
| Net Debt | 41,855 | |||||||||
| Equity Value | -672,452 | |||||||||
| Diluted Shares Outstanding, MM | 4,526 | |||||||||
| Equity Value Per Share | -148.58 |
What You Will Receive
- Customizable Excel Template: A fully adaptable Excel-based DCF Calculator featuring pre-filled historical financials for New Hope Liuhe Co., Ltd. (000876SZ).
- Real-World Data: Access to historical data and forward-looking projections (highlighted in the yellow cells).
- Forecasting Flexibility: Modify forecast assumptions such as revenue growth rates, EBITDA percentages, and WACC.
- Instant Calculations: View immediate effects of your inputs on the valuation of New Hope Liuhe Co., Ltd. (000876SZ).
- Professional Resource: Designed for investors, CFOs, consultants, and financial analysts.
- User-Friendly Interface: Organized for clarity and ease, complete with step-by-step guidance.
Key Features
- Customizable Financial Inputs: Adjust essential variables such as revenue growth, EBITDA percentage, and capital expenditures tailored for New Hope Liuhe Co., Ltd. (000876SZ).
- Instant DCF Valuation: Automatically computes intrinsic value, net present value (NPV), and other financial metrics.
- High-Precision Results: Leverages New Hope Liuhe's actual financial data for accurate valuation insights.
- Effortless Scenario Analysis: Easily explore various assumptions and assess their impacts on outcomes.
- Efficiency Booster: Streamline your workflow by removing the hassle of constructing complex valuation models from the ground up.
How It Works
- Step 1: Download the prebuilt Excel template featuring New Hope Liuhe Co., Ltd.'s (000876SZ) data.
- Step 2: Navigate through the pre-filled sheets to familiarize yourself with the essential metrics.
- Step 3: Modify forecasts and assumptions in the editable yellow cells (WACC, growth, margins).
- Step 4: Instantly view the recalculated results, including New Hope Liuhe Co., Ltd.'s (000876SZ) intrinsic value.
- Step 5: Use the outputs to make informed investment decisions or create reports.
Why Choose This Calculator for New Hope Liuhe Co., Ltd. (000876SZ)?
- Reliable Data: Utilize authentic financials from New Hope Liuhe for accurate valuation insights.
- Customizable Options: Tailor vital inputs such as growth rates, WACC, and tax rates to align with your forecasts.
- Efficiency Boost: Built-in calculations save you the hassle of starting from the ground up.
- Professional Quality: Crafted for investors, financial analysts, and industry consultants.
- User-Centric Design: Easy-to-navigate interface and detailed instructions ensure accessibility for all users.
Who Should Use This Product?
- Individual Investors: Make informed decisions regarding the purchase or sale of New Hope Liuhe Co., Ltd. (000876SZ) stock.
- Financial Analysts: Enhance valuation procedures with comprehensive financial models tailored for New Hope Liuhe Co., Ltd. (000876SZ).
- Consultants: Provide clients with accurate and quick valuation insights for New Hope Liuhe Co., Ltd. (000876SZ).
- Business Owners: Gain a deeper understanding of how major companies like New Hope Liuhe Co., Ltd. (000876SZ) are valued to inform your own strategic decisions.
- Finance Students: Acquire valuation skills using real-world data and case studies related to New Hope Liuhe Co., Ltd. (000876SZ).
What the Template Includes
- Extensive DCF Model: An editable template featuring thorough valuation calculations.
- Relevant Market Data: Preloaded historical and projected financials for New Hope Liuhe Co., Ltd. (000876SZ) to facilitate analysis.
- Customizable Assumptions: Modify WACC, growth rates, and tax considerations to explore various scenarios.
- Detailed Financial Statements: Comprehensive annual and quarterly financial breakdowns for enhanced insights.
- Essential Ratios: Integrated analysis of profitability, efficiency, and leverage metrics.
- Interactive Dashboard with Visual Displays: Graphs and tables presenting clear, actionable results.
Disclaimer
All information, articles, and product details provided on this website are for general informational and educational purposes only. We do not claim any ownership over, nor do we intend to infringe upon, any trademarks, copyrights, logos, brand names, or other intellectual property mentioned or depicted on this site. Such intellectual property remains the property of its respective owners, and any references here are made solely for identification or informational purposes, without implying any affiliation, endorsement, or partnership.
We make no representations or warranties, express or implied, regarding the accuracy, completeness, or suitability of any content or products presented. Nothing on this website should be construed as legal, tax, investment, financial, medical, or other professional advice. In addition, no part of this site—including articles or product references—constitutes a solicitation, recommendation, endorsement, advertisement, or offer to buy or sell any securities, franchises, or other financial instruments, particularly in jurisdictions where such activity would be unlawful.
All content is of a general nature and may not address the specific circumstances of any individual or entity. It is not a substitute for professional advice or services. Any actions you take based on the information provided here are strictly at your own risk. You accept full responsibility for any decisions or outcomes arising from your use of this website and agree to release us from any liability in connection with your use of, or reliance upon, the content or products found herein.