
|
شركة Guangdong Haid Group Co.، Limited (002311.SZ) تقييم DCF |
Fully Editable: Tailor To Your Needs In Excel Or Sheets
Professional Design: Trusted, Industry-Standard Templates
Investor-Approved Valuation Models
MAC/PC Compatible, Fully Unlocked
No Expertise Is Needed; Easy To Follow
Guangdong Haid Group Co., Limited (002311.SZ) Bundle
Enhance your investment choices with the (002311SZ) DCF Calculator! Retrieve genuine financial data for Guangdong Haid Group Co., Limited, adjust growth predictions and expenses, and observe how these modifications affect the intrinsic value of (Guangdong Haid Group Co., Limited) in real-time.
What You Will Receive
- Authentic 002311SZ Financials: Provides both historical and projected data for precise valuation.
- Customizable Inputs: Adjust parameters such as WACC, tax rates, revenue growth, and capital expenditures.
- Automated Calculations: Intrinsic value and NPV are computed in real-time.
- Scenario Analysis: Assess various scenarios to analyze the future performance of Guangdong Haid Group Co., Limited.
- User-Friendly Design: Engineered for professionals while remaining approachable for newcomers.
Key Features
- Comprehensive DCF Calculator: Features robust unlevered and levered DCF valuation models tailored for Guangdong Haid Group Co., Limited (002311SZ).
- WACC Calculator: Comes with a pre-configured Weighted Average Cost of Capital sheet that allows for customizable inputs.
- Customizable Forecast Assumptions: Adjust key variables such as growth rates, capital expenditures, and discount rates.
- Integrated Financial Ratios: Evaluate profitability, leverage, and efficiency metrics specifically for Guangdong Haid Group Co., Limited (002311SZ).
- Interactive Dashboard and Charts: Visual representations summarize essential valuation indicators for straightforward analysis.
How It Functions
- 1. Download the Template: Obtain and open the Excel file containing Guangdong Haid Group Co., Limited's preloaded data.
- 2. Modify Inputs: Adjust critical assumptions such as growth rates, WACC, and capital expenditures to fit your analysis.
- 3. Analyze Results Immediately: The DCF model automatically computes the intrinsic value and NPV based on your inputs.
- 4. Explore Different Scenarios: Evaluate various projections to understand distinct valuation possibilities.
- 5. Make Informed Decisions: Present thorough valuation insights for Guangdong Haid Group Co., Limited [002311SZ] to guide your strategic choices.
Why Choose This Calculator for Guangdong Haid Group Co., Limited (002311SZ)?
- User-Friendly Interface: Suitable for both novices and seasoned professionals.
- Customizable Inputs: Adjust parameters easily to suit your financial analysis.
- Real-Time Adjustments: Witness immediate shifts in Guangdong Haid Group's valuation as you modify inputs.
- Preloaded Financial Data: Comes ready with Guangdong Haid Group’s actual financial figures for swift evaluations.
- Relied Upon by Experts: A go-to tool for investors and analysts to make well-informed choices.
Who Can Benefit from This Product?
- Investors: Precisely evaluate the fair value of Guangdong Haid Group Co., Limited (002311SZ) before making investment choices.
- CFOs: Utilize a professional-grade DCF model for comprehensive financial reporting and analysis.
- Consultants: Efficiently customize the template for creating valuation reports for various clients.
- Entrepreneurs: Acquire valuable insights into the financial modeling practices employed by leading companies.
- Educators: Implement it as a resource for teaching valuation methodologies effectively.
Contents of the Template
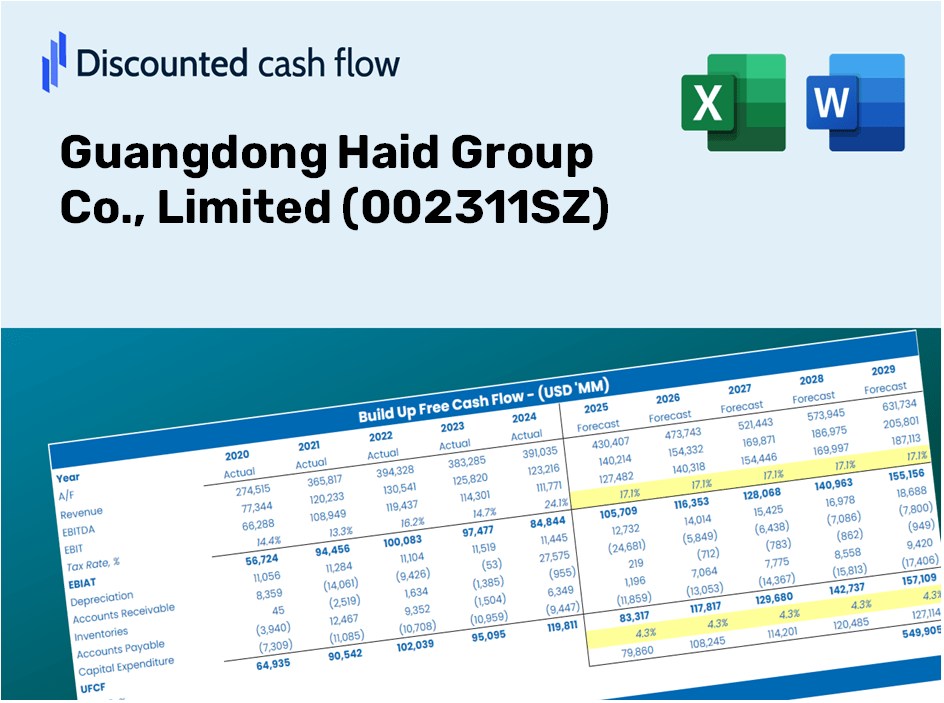
- Operating and Balance Sheet Data: Pre-filled historical data and forecasts for Guangdong Haid Group Co., Limited (002311SZ), including revenue, EBITDA, EBIT, and capital expenditures.
- WACC Calculation: A dedicated sheet for Weighted Average Cost of Capital (WACC), featuring parameters such as Beta, risk-free rate, and share price.
- DCF Valuation (Unlevered and Levered): Editable Discounted Cash Flow models that illustrate intrinsic value along with detailed calculations.
- Financial Statements: Pre-loaded annual and quarterly financial statements to facilitate analysis.
- Key Ratios: Comprehensive set of profitability, leverage, and efficiency ratios for Guangdong Haid Group Co., Limited (002311SZ).
- Dashboard and Charts: Visual representation of valuation outputs and assumptions for easy result analysis.
Disclaimer
All information, articles, and product details provided on this website are for general informational and educational purposes only. We do not claim any ownership over, nor do we intend to infringe upon, any trademarks, copyrights, logos, brand names, or other intellectual property mentioned or depicted on this site. Such intellectual property remains the property of its respective owners, and any references here are made solely for identification or informational purposes, without implying any affiliation, endorsement, or partnership.
We make no representations or warranties, express or implied, regarding the accuracy, completeness, or suitability of any content or products presented. Nothing on this website should be construed as legal, tax, investment, financial, medical, or other professional advice. In addition, no part of this site—including articles or product references—constitutes a solicitation, recommendation, endorsement, advertisement, or offer to buy or sell any securities, franchises, or other financial instruments, particularly in jurisdictions where such activity would be unlawful.
All content is of a general nature and may not address the specific circumstances of any individual or entity. It is not a substitute for professional advice or services. Any actions you take based on the information provided here are strictly at your own risk. You accept full responsibility for any decisions or outcomes arising from your use of this website and agree to release us from any liability in connection with your use of, or reliance upon, the content or products found herein.