
|
شركة Chongqing Fuling Zhacai Group ، Ltd. (002507.SZ) تقييم DCF |
Fully Editable: Tailor To Your Needs In Excel Or Sheets
Professional Design: Trusted, Industry-Standard Templates
Investor-Approved Valuation Models
MAC/PC Compatible, Fully Unlocked
No Expertise Is Needed; Easy To Follow
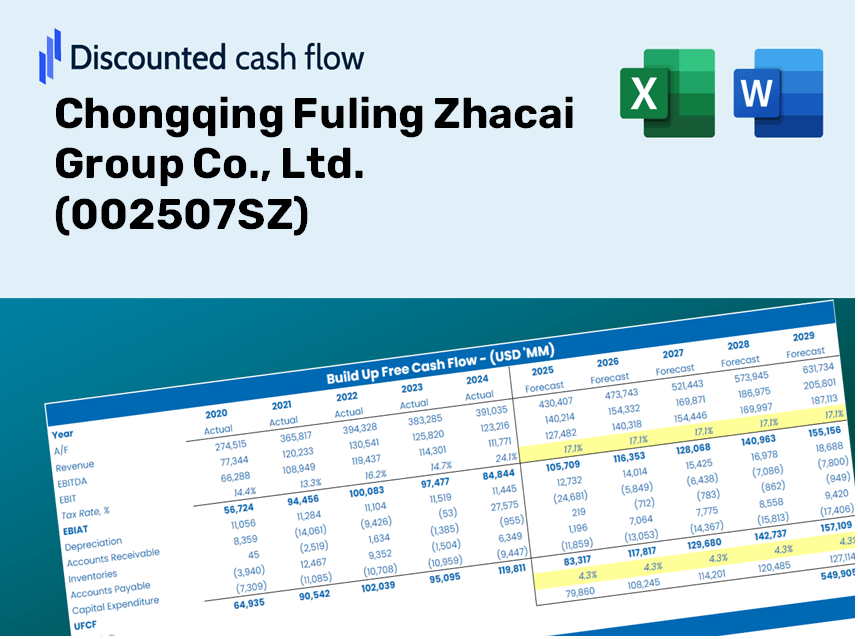
Chongqing Fuling Zhacai Group Co., Ltd. (002507.SZ) Bundle
Explore the financial potential of Chongqing Fuling Zhacai Group Co., Ltd. (002507SZ) with our user-friendly DCF Calculator! Enter your forecasts for growth, margins, and expenses to calculate the intrinsic value of Chongqing Fuling Zhacai Group Co., Ltd. (002507SZ) and enhance your investment decisions.
Benefits You Will Receive
- Authentic 002507SZ Financials: Access to historical data and future projections for precise valuation.
- Customizable Inputs: Adjust WACC, tax rates, revenue growth, and capital expenditures as needed.
- Instant Calculations: Intrinsic value and NPV are computed in real-time.
- Scenario Analysis: Explore various scenarios to assess the future performance of Chongqing Fuling Zhacai Group Co., Ltd.
- User-Friendly Design: Designed for professionals but easy enough for beginners to navigate.
Key Features
- Authentic Fuling Zhacai Data: Pre-populated with Chongqing Fuling Zhacai Group Co., Ltd.'s historical financial details and future growth forecasts.
- Completely Adjustable Inputs: Tailor revenue growth rates, profit margins, WACC, tax rates, and capital expenditure assumptions.
- Adaptive Valuation Framework: Automatic recalculations of Net Present Value (NPV) and intrinsic value based on your customized parameters.
- Comprehensive Scenario Analysis: Generate multiple forecasting scenarios to evaluate various valuation results.
- Intuitive Interface: Designed for ease of use, making it accessible for both industry professionals and newcomers.
How It Works
- Step 1: Download the Excel file.
- Step 2: Examine the pre-filled financial data and projections for Chongqing Fuling Zhacai Group Co., Ltd. (002507SZ).
- Step 3: Adjust key inputs such as revenue growth, WACC, and tax rates (marked cells).
- Step 4: Observe how the DCF model refreshes in real-time as you alter your assumptions.
- Step 5: Evaluate the results and leverage the findings for your investment strategies.
Why Choose the Fuling Zhacai Calculator?
- Precision: Leverages authentic financial data from Chongqing Fuling Zhacai Group Co., Ltd. for reliable outputs.
- Adaptability: Built to allow users to easily experiment with and adjust various inputs.
- Efficiency: Bypass the complexities of constructing a financial model from the ground up.
- High-Quality Standards: Crafted with the expertise and attention to detail expected from a leading company like Fuling Zhacai.
- Intuitive Interface: User-friendly design that caters to both novices and experienced financial analysts alike.
Who Can Benefit from This Product?
- Investors: Assess the valuation of Chongqing Fuling Zhacai Group Co., Ltd. (002507SZ) before making investment decisions.
- CFOs and Financial Analysts: Enhance valuation methodologies and evaluate financial forecasts.
- Startup Founders: Gain insights into the valuation practices of established companies like Chongqing Fuling Zhacai Group Co., Ltd. (002507SZ).
- Consultants: Create comprehensive valuation reports for your clients using relevant data.
- Students and Educators: Utilize real market data to learn and teach valuation strategies effectively.
What the Template Contains
- Historical Data: Contains Chongqing Fuling Zhacai Group Co., Ltd.'s (002507SZ) previous financial performance and foundational forecasts.
- DCF and Levered DCF Models: Comprehensive templates designed to ascertain the intrinsic value of Chongqing Fuling Zhacai Group Co., Ltd. (002507SZ).
- WACC Sheet: Pre-constructed calculations for the Weighted Average Cost of Capital.
- Editable Inputs: Customize key factors such as growth rates, EBITDA %, and CAPEX projections.
- Quarterly and Annual Statements: An extensive analysis of Chongqing Fuling Zhacai Group Co., Ltd.'s (002507SZ) financial statements.
- Interactive Dashboard: Dynamically visualize valuation outcomes and projections.
Disclaimer
All information, articles, and product details provided on this website are for general informational and educational purposes only. We do not claim any ownership over, nor do we intend to infringe upon, any trademarks, copyrights, logos, brand names, or other intellectual property mentioned or depicted on this site. Such intellectual property remains the property of its respective owners, and any references here are made solely for identification or informational purposes, without implying any affiliation, endorsement, or partnership.
We make no representations or warranties, express or implied, regarding the accuracy, completeness, or suitability of any content or products presented. Nothing on this website should be construed as legal, tax, investment, financial, medical, or other professional advice. In addition, no part of this site—including articles or product references—constitutes a solicitation, recommendation, endorsement, advertisement, or offer to buy or sell any securities, franchises, or other financial instruments, particularly in jurisdictions where such activity would be unlawful.
All content is of a general nature and may not address the specific circumstances of any individual or entity. It is not a substitute for professional advice or services. Any actions you take based on the information provided here are strictly at your own risk. You accept full responsibility for any decisions or outcomes arising from your use of this website and agree to release us from any liability in connection with your use of, or reliance upon, the content or products found herein.