
|
شركة Tangrenshen Group Co.، Ltd (002567.SZ) تقييم DCF |
Fully Editable: Tailor To Your Needs In Excel Or Sheets
Professional Design: Trusted, Industry-Standard Templates
Investor-Approved Valuation Models
MAC/PC Compatible, Fully Unlocked
No Expertise Is Needed; Easy To Follow
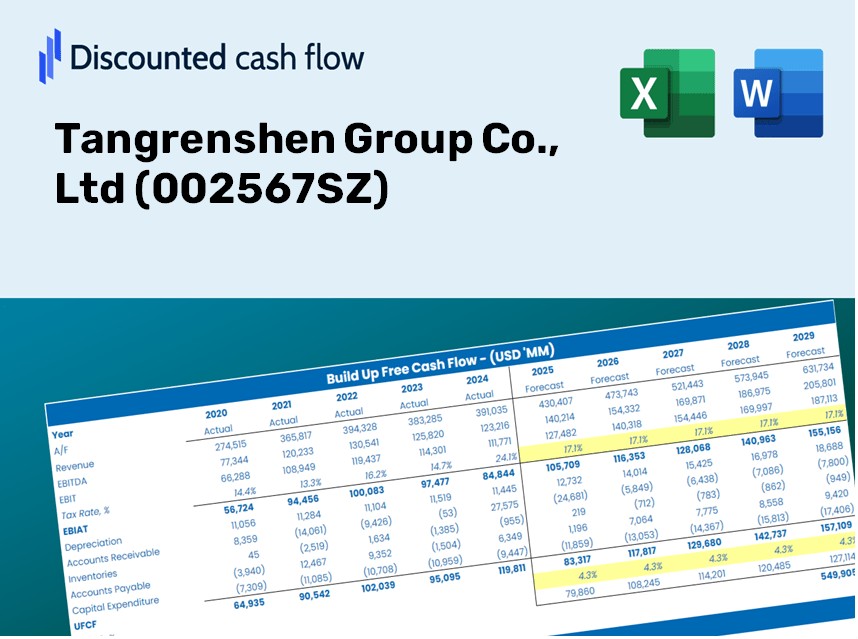
Tangrenshen Group Co., Ltd (002567.SZ) Bundle
Evaluate the financial outlook of Tangrenshen Group Co., Ltd like a professional! This (002567SZ) DCF Calculator comes with pre-filled financial data and allows you the flexibility to modify revenue growth, WACC, margins, and other essential assumptions to align with your projections.
What You Will Receive
- Authentic Tangrenshen Data: Preloaded financial information – covering everything from revenue to EBIT – based on actual and projected performance.
- Comprehensive Customization: Modify all essential parameters (yellow cells) such as WACC, growth rate, and tax percentages.
- Real-Time Valuation Adjustments: Automatic recalculations to assess the effect of changes on the fair value of Tangrenshen Group Co., Ltd (002567SZ).
- Flexible Excel Template: Designed for easy edits, scenario analysis, and detailed forecasting.
- Efficient and Precise: Avoid the hassle of building models from the ground up while ensuring accuracy and adaptability.
Key Features
- Comprehensive TGR Data: Comes pre-loaded with Tangrenshen Group Co., Ltd's historical financial data and future growth projections.
- Highly Customizable Inputs: Modify revenue growth rates, profit margins, WACC, tax rates, and capital expenditures to suit your analysis.
- Adaptive Valuation Model: Automatically refreshes Net Present Value (NPV) and intrinsic value in response to your adjustments.
- Scenario Analysis: Generate multiple forecasting scenarios to evaluate different valuation results.
- Intuitive Interface: Designed to be accessible and easy to navigate for both professionals and newcomers.
How It Works
- Step 1: Download the Excel file.
- Step 2: Examine the pre-filled data for Tangrenshen Group Co., Ltd (002567SZ), including historical and projected figures.
- Step 3: Modify key assumptions (yellow cells) based on your insights.
- Step 4: Monitor real-time recalculations for Tangrenshen's intrinsic value.
- Step 5: Utilize the results for investment analysis or reporting purposes.
Why Choose This Calculator for Tangrenshen Group Co., Ltd (002567SZ)?
- Reliable Data: Access accurate financials from Tangrenshen Group for trustworthy valuation outcomes.
- Tailorable: Modify essential parameters such as growth projections, WACC, and tax rates to fit your forecasts.
- Efficiency: Ready-to-use calculations save you from starting from the ground up.
- Professional-Quality Tool: Crafted for investors, analysts, and consultants.
- Easy to Use: User-friendly interface and clear, step-by-step guidance ensure accessibility for everyone.
Who Should Use This Product?
- Finance Students: Acquire essential valuation skills and apply them with live data on Tangrenshen Group Co., Ltd (002567SZ).
- Academics: Integrate advanced financial models into your lectures or research focusing on Tangrenshen Group Co., Ltd (002567SZ).
- Investors: Validate your investment hypotheses and evaluate valuation results for Tangrenshen Group Co., Ltd (002567SZ).
- Analysts: Enhance your analysis process using a ready-to-use, adaptable DCF model tailored for Tangrenshen Group Co., Ltd (002567SZ).
- Small Business Owners: Discover how major publicly traded companies like Tangrenshen Group Co., Ltd (002567SZ) are assessed.
Contents of the Template
- Pre-Filled DCF Model: Tangrenshen Group’s financial data ready for immediate application.
- WACC Calculator: Comprehensive calculations for the Weighted Average Cost of Capital.
- Financial Ratios: Analyze Tangrenshen Group's profitability, leverage, and efficiency metrics.
- Editable Inputs: Modify assumptions such as growth rates, profit margins, and CAPEX to suit your analysis.
- Financial Statements: Access annual and quarterly reports for in-depth examination.
- Interactive Dashboard: Visually represent key valuation metrics and outcomes with ease.
Disclaimer
All information, articles, and product details provided on this website are for general informational and educational purposes only. We do not claim any ownership over, nor do we intend to infringe upon, any trademarks, copyrights, logos, brand names, or other intellectual property mentioned or depicted on this site. Such intellectual property remains the property of its respective owners, and any references here are made solely for identification or informational purposes, without implying any affiliation, endorsement, or partnership.
We make no representations or warranties, express or implied, regarding the accuracy, completeness, or suitability of any content or products presented. Nothing on this website should be construed as legal, tax, investment, financial, medical, or other professional advice. In addition, no part of this site—including articles or product references—constitutes a solicitation, recommendation, endorsement, advertisement, or offer to buy or sell any securities, franchises, or other financial instruments, particularly in jurisdictions where such activity would be unlawful.
All content is of a general nature and may not address the specific circumstances of any individual or entity. It is not a substitute for professional advice or services. Any actions you take based on the information provided here are strictly at your own risk. You accept full responsibility for any decisions or outcomes arising from your use of this website and agree to release us from any liability in connection with your use of, or reliance upon, the content or products found herein.