
|
الصين في الخارج & الاستثمار Limited (0688.HK) تقييم DCF |
Fully Editable: Tailor To Your Needs In Excel Or Sheets
Professional Design: Trusted, Industry-Standard Templates
Investor-Approved Valuation Models
MAC/PC Compatible, Fully Unlocked
No Expertise Is Needed; Easy To Follow
China Overseas Land & Investment Limited (0688.HK) Bundle
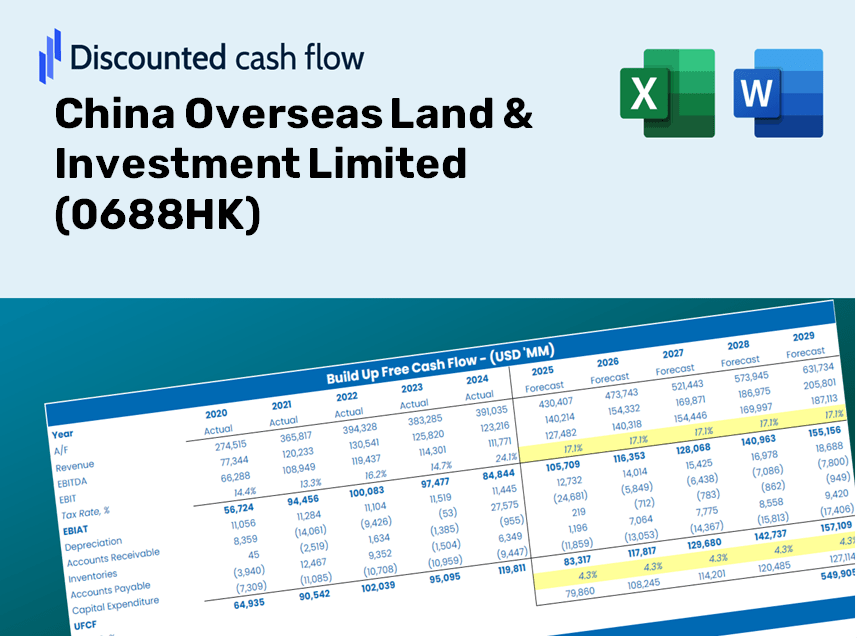
Evaluate the financial prospects of China Overseas Land & Investment Limited (0688HK) like an expert! This (0688HK) DCF Calculator provides pre-filled financial data and allows you to customize revenue growth, WACC, margins, and other essential assumptions to align with your predictions.
Discounted Cash Flow (DCF) - (USD MM)
| Year | AY1 2020 |
AY2 2021 |
AY3 2022 |
AY4 2023 |
AY5 2024 |
FY1 2025 |
FY2 2026 |
FY3 2027 |
FY4 2028 |
FY5 2029 |
|---|---|---|---|---|---|---|---|---|---|---|
| Revenue | 203,204.1 | 322,289.4 | 197,223.6 | 221,507.2 | 202,509.1 | 214,423.8 | 227,039.6 | 240,397.7 | 254,541.6 | 269,517.8 |
| Revenue Growth, % | 0 | 58.6 | -38.81 | 12.31 | -8.58 | 5.88 | 5.88 | 5.88 | 5.88 | 5.88 |
| EBITDA | 65,502.9 | 70,440.3 | 41,267.5 | 46,547.0 | 30,408.6 | 47,621.4 | 50,423.3 | 53,390.0 | 56,531.2 | 59,857.2 |
| EBITDA, % | 32.24 | 21.86 | 20.92 | 21.01 | 15.02 | 22.21 | 22.21 | 22.21 | 22.21 | 22.21 |
| Depreciation | 455.8 | 446.2 | 729.8 | 443.1 | 502.6 | 506.5 | 536.3 | 567.8 | 601.2 | 636.6 |
| Depreciation, % | 0.2243 | 0.13844 | 0.37001 | 0.20003 | 0.24819 | 0.23619 | 0.23619 | 0.23619 | 0.23619 | 0.23619 |
| EBIT | 65,047.1 | 69,994.1 | 40,537.7 | 46,103.9 | 29,906.0 | 47,115.0 | 49,887.0 | 52,822.2 | 55,930.0 | 59,220.7 |
| EBIT, % | 32.01 | 21.72 | 20.55 | 20.81 | 14.77 | 21.97 | 21.97 | 21.97 | 21.97 | 21.97 |
| Total Cash | 143,253.2 | 175,209.7 | 135,453.4 | 115,529.9 | 135,806.9 | 134,126.3 | 142,017.7 | 150,373.4 | 159,220.8 | 168,588.6 |
| Total Cash, percent | .0 | .0 | .0 | .0 | .0 | .0 | .0 | .0 | .0 | .0 |
| Account Receivables | 33,507.1 | 33,290.5 | 28,367.7 | 24,515.3 | 16,808.9 | 25,975.4 | 27,503.6 | 29,121.8 | 30,835.2 | 32,649.5 |
| Account Receivables, % | 16.49 | 10.33 | 14.38 | 11.07 | 8.3 | 12.11 | 12.11 | 12.11 | 12.11 | 12.11 |
| Inventories | 515,684.7 | 506,408.2 | 547,175.2 | 542,760.3 | 503,374.7 | 214,423.8 | 227,039.6 | 240,397.7 | 254,541.6 | 269,517.8 |
| Inventories, % | 253.78 | 157.13 | 277.44 | 245.03 | 248.57 | 100 | 100 | 100 | 100 | 100 |
| Accounts Payable | 79,695.3 | 85,932.4 | 75,653.5 | 82,005.9 | 52,436.6 | 71,684.9 | 75,902.5 | 80,368.3 | 85,096.8 | 90,103.5 |
| Accounts Payable, % | 39.22 | 26.66 | 38.36 | 37.02 | 25.89 | 33.43 | 33.43 | 33.43 | 33.43 | 33.43 |
| Capital Expenditure | -384.3 | -298.1 | -803.6 | -224.0 | -216.6 | -384.7 | -407.4 | -431.3 | -456.7 | -483.6 |
| Capital Expenditure, % | -0.1891 | -0.09248778 | -0.40745 | -0.10112 | -0.10696 | -0.17942 | -0.17942 | -0.17942 | -0.17942 | -0.17942 |
| Tax Rate, % | 40.79 | 40.79 | 40.79 | 40.79 | 40.79 | 40.79 | 40.79 | 40.79 | 40.79 | 40.79 |
| EBITAT | 41,267.0 | 39,231.5 | 26,192.2 | 28,713.6 | 17,706.8 | 28,795.9 | 30,490.1 | 32,284.0 | 34,183.5 | 36,194.7 |
| Depreciation | ||||||||||
| Changes in Account Receivables | ||||||||||
| Changes in Inventories | ||||||||||
| Changes in Accounts Payable | ||||||||||
| Capital Expenditure | ||||||||||
| UFCF | -428,158.0 | 55,109.8 | -20,004.7 | 43,552.4 | 35,515.4 | 327,950.3 | 20,692.6 | 21,910.1 | 23,199.1 | 24,564.1 |
| WACC, % | 3.1 | 2.93 | 3.13 | 3.07 | 3 | 3.05 | 3.05 | 3.05 | 3.05 | 3.05 |
| PV UFCF | ||||||||||
| SUM PV UFCF | 399,479.3 | |||||||||
| Long Term Growth Rate, % | 2.00 | |||||||||
| Free cash flow (T + 1) | 25,055 | |||||||||
| Terminal Value | 2,393,187 | |||||||||
| Present Terminal Value | 2,059,686 | |||||||||
| Enterprise Value | 2,459,165 | |||||||||
| Net Debt | 129,475 | |||||||||
| Equity Value | 2,329,690 | |||||||||
| Diluted Shares Outstanding, MM | 10,945 | |||||||||
| Equity Value Per Share | 212.86 |
What You Will Receive
- Authentic COLI Data: Preloaded financial information – covering everything from revenue to EBIT – based on actual and forecasted figures.
- Complete Customization: Modify all essential parameters (yellow cells) such as WACC, growth %, and tax rates.
- Real-Time Valuation Updates: Automatic recalculations to assess the effects of changes on COLI's fair value.
- Flexible Excel Template: Designed for quick modifications, scenario analysis, and comprehensive projections.
- Efficient and Precise: Eliminate the need to construct models from the ground up while ensuring accuracy and adaptability.
Key Features
- Pre-Loaded Data: Historical financial statements and pre-filled forecasts for China Overseas Land & Investment Limited (0688HK).
- Fully Adjustable Inputs: Modify WACC, tax rates, revenue growth, and EBITDA margins as needed.
- Instant Results: Watch the intrinsic value of China Overseas Land & Investment Limited (0688HK) recalculate in real time.
- Clear Visual Outputs: Dashboard charts present valuation results and key metrics clearly.
- Built for Accuracy: A professional tool designed for analysts, investors, and finance professionals.
How It Functions
- Download: Obtain the pre-prepared Excel file containing financial data for China Overseas Land & Investment Limited (0688HK).
- Customize: Modify forecasts such as revenue growth, EBITDA %, and WACC to fit your analysis.
- Update Automatically: Enjoy real-time updates for intrinsic value and NPV calculations.
- Test Scenarios: Develop various projections and instantly compare their outcomes.
- Make Decisions: Leverage the valuation results to inform your investment strategy.
Why Use This Calculator for China Overseas Land & Investment Limited (0688HK)?
- All-in-One Solution: Combines DCF, WACC, and financial ratio analyses in a single tool.
- Flexible Inputs: Modify the yellow-highlighted fields to explore different scenarios.
- Comprehensive Analysis: Automatically computes the intrinsic value and Net Present Value for China Overseas Land & Investment Limited (0688HK).
- Data Ready: Comes with historical and projected data for a solid foundation.
- Designed for Professionals: Perfect for financial analysts, investors, and consultants specializing in real estate and infrastructure.
Who Should Benefit from This Product?
- Professional Investors: Create comprehensive and dependable valuation models for portfolio assessment related to China Overseas Land & Investment Limited (0688HK).
- Corporate Finance Teams: Evaluate valuation scenarios to inform and enhance internal strategic planning.
- Consultants and Advisors: Deliver precise valuation insights to clients focused on China Overseas Land & Investment Limited (0688HK).
- Students and Educators: Leverage real-world data for practical exercises and instruction in financial modeling.
- Real Estate Enthusiasts: Gain insights into how property development companies like China Overseas Land & Investment Limited (0688HK) are valued in the market.
Contents of the Template
- Historical Data: Provides past financials and baseline forecasts for China Overseas Land & Investment Limited (0688HK).
- DCF and Levered DCF Models: Comprehensive templates for determining the intrinsic value of China Overseas Land & Investment Limited (0688HK).
- WACC Sheet: Pre-configured calculations for the Weighted Average Cost of Capital.
- Editable Inputs: Customize key parameters such as growth rates, EBITDA %, and CAPEX assumptions.
- Quarterly and Annual Statements: A thorough analysis of China Overseas Land & Investment Limited (0688HK) financials.
- Interactive Dashboard: Dynamically visualize valuation results and forecasts.
Disclaimer
All information, articles, and product details provided on this website are for general informational and educational purposes only. We do not claim any ownership over, nor do we intend to infringe upon, any trademarks, copyrights, logos, brand names, or other intellectual property mentioned or depicted on this site. Such intellectual property remains the property of its respective owners, and any references here are made solely for identification or informational purposes, without implying any affiliation, endorsement, or partnership.
We make no representations or warranties, express or implied, regarding the accuracy, completeness, or suitability of any content or products presented. Nothing on this website should be construed as legal, tax, investment, financial, medical, or other professional advice. In addition, no part of this site—including articles or product references—constitutes a solicitation, recommendation, endorsement, advertisement, or offer to buy or sell any securities, franchises, or other financial instruments, particularly in jurisdictions where such activity would be unlawful.
All content is of a general nature and may not address the specific circumstances of any individual or entity. It is not a substitute for professional advice or services. Any actions you take based on the information provided here are strictly at your own risk. You accept full responsibility for any decisions or outcomes arising from your use of this website and agree to release us from any liability in connection with your use of, or reliance upon, the content or products found herein.