
|
شركة Hisense Home Appliances Group ، Ltd. (0921.HK) تقييم DCF |
Fully Editable: Tailor To Your Needs In Excel Or Sheets
Professional Design: Trusted, Industry-Standard Templates
Investor-Approved Valuation Models
MAC/PC Compatible, Fully Unlocked
No Expertise Is Needed; Easy To Follow
Hisense Home Appliances Group Co., Ltd. (0921.HK) Bundle
Explore the financial prospects of Hisense Home Appliances Group Co., Ltd. (0921HK) with our user-friendly DCF Calculator! Enter your assumptions for growth, margins, and expenses to calculate the intrinsic value of Hisense Home Appliances Group Co., Ltd. (0921HK) and enhance your investment strategy.
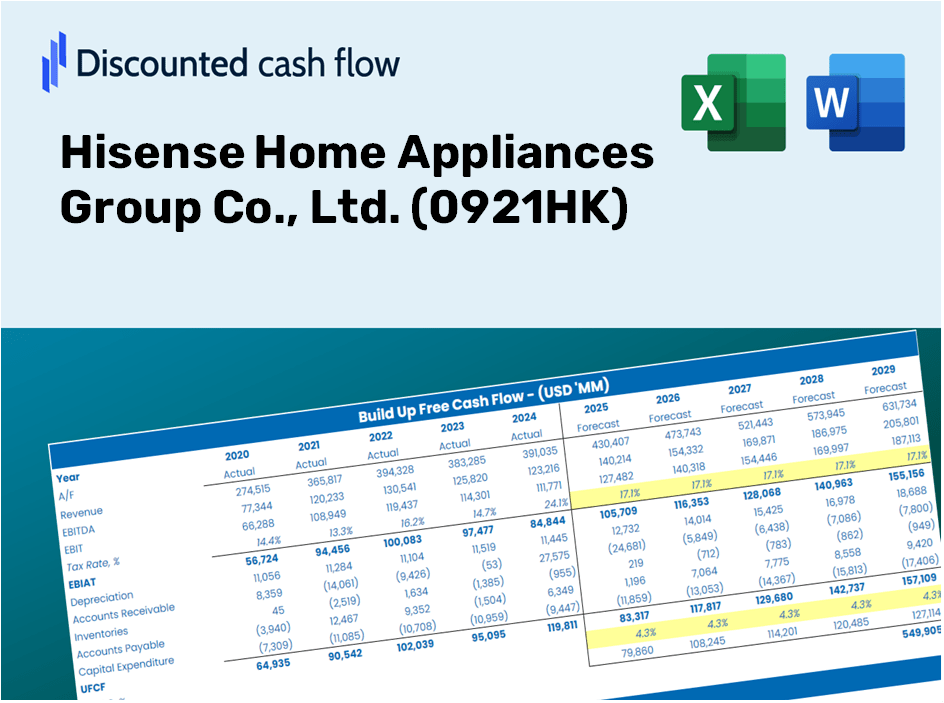
Discounted Cash Flow (DCF) - (USD MM)
| Year | AY1 2020 |
AY2 2021 |
AY3 2022 |
AY4 2023 |
AY5 2024 |
FY1 2025 |
FY2 2026 |
FY3 2027 |
FY4 2028 |
FY5 2029 |
|---|---|---|---|---|---|---|---|---|---|---|
| Revenue | 53,039.1 | 74,049.3 | 81,231.0 | 93,818.7 | 101,650.2 | 120,240.7 | 142,231.1 | 168,243.4 | 199,012.9 | 235,409.8 |
| Revenue Growth, % | 0 | 39.61 | 9.7 | 15.5 | 8.35 | 18.29 | 18.29 | 18.29 | 18.29 | 18.29 |
| EBITDA | 4,102.6 | 4,471.6 | 5,776.5 | 7,715.9 | 7,953.4 | 8,881.8 | 10,506.2 | 12,427.6 | 14,700.5 | 17,389.0 |
| EBITDA, % | 7.74 | 6.04 | 7.11 | 8.22 | 7.82 | 7.39 | 7.39 | 7.39 | 7.39 | 7.39 |
| Depreciation | 1,143.3 | 1,230.6 | 1,489.0 | 1,327.3 | 1,250.0 | 1,994.8 | 2,359.6 | 2,791.1 | 3,301.6 | 3,905.4 |
| Depreciation, % | 2.16 | 1.66 | 1.83 | 1.41 | 1.23 | 1.66 | 1.66 | 1.66 | 1.66 | 1.66 |
| EBIT | 2,959.3 | 3,241.0 | 4,287.5 | 6,388.6 | 6,703.5 | 6,887.0 | 8,146.6 | 9,636.5 | 11,398.9 | 13,483.6 |
| EBIT, % | 5.58 | 4.38 | 5.28 | 6.81 | 6.59 | 5.73 | 5.73 | 5.73 | 5.73 | 5.73 |
| Total Cash | 10,666.0 | 13,862.8 | 13,984.6 | 19,872.1 | 22,585.5 | 23,915.1 | 28,288.9 | 33,462.5 | 39,582.4 | 46,821.5 |
| Total Cash, percent | .0 | .0 | .0 | .0 | .0 | .0 | .0 | .0 | .0 | .0 |
| Account Receivables | 12,476.8 | 13,881.2 | 14,127.3 | 16,052.4 | 18,894.3 | 22,932.0 | 27,126.0 | 32,087.0 | 37,955.3 | 44,896.8 |
| Account Receivables, % | 23.52 | 18.75 | 17.39 | 17.11 | 18.59 | 19.07 | 19.07 | 19.07 | 19.07 | 19.07 |
| Inventories | 4,707.7 | 9,246.7 | 7,182.0 | 7,425.0 | 8,293.4 | 11,128.9 | 13,164.2 | 15,571.8 | 18,419.6 | 21,788.4 |
| Inventories, % | 8.88 | 12.49 | 8.84 | 7.91 | 8.16 | 9.26 | 9.26 | 9.26 | 9.26 | 9.26 |
| Accounts Payable | 19,801.8 | 25,529.6 | 23,060.0 | 29,217.8 | 31,763.5 | 39,099.8 | 46,250.7 | 54,709.3 | 64,715.0 | 76,550.5 |
| Accounts Payable, % | 37.33 | 34.48 | 28.39 | 31.14 | 31.25 | 32.52 | 32.52 | 32.52 | 32.52 | 32.52 |
| Capital Expenditure | -672.6 | -1,213.5 | -968.3 | -1,079.7 | -1,527.8 | -1,623.9 | -1,920.9 | -2,272.2 | -2,687.8 | -3,179.3 |
| Capital Expenditure, % | -1.27 | -1.64 | -1.19 | -1.15 | -1.5 | -1.35 | -1.35 | -1.35 | -1.35 | -1.35 |
| Tax Rate, % | 43.89 | 43.89 | 43.89 | 43.89 | 43.89 | 43.89 | 43.89 | 43.89 | 43.89 | 43.89 |
| EBITAT | 2,416.6 | 2,603.4 | 3,441.4 | 3,188.7 | 3,761.5 | 4,797.3 | 5,674.6 | 6,712.4 | 7,940.1 | 9,392.2 |
| Depreciation | ||||||||||
| Changes in Account Receivables | ||||||||||
| Changes in Inventories | ||||||||||
| Changes in Accounts Payable | ||||||||||
| Capital Expenditure | ||||||||||
| UFCF | 5,504.7 | 2,404.8 | 3,311.1 | 7,425.9 | 2,319.2 | 5,631.3 | 7,034.9 | 8,321.5 | 9,843.4 | 11,643.6 |
| WACC, % | 6.83 | 6.82 | 6.82 | 6.69 | 6.71 | 6.77 | 6.77 | 6.77 | 6.77 | 6.77 |
| PV UFCF | ||||||||||
| SUM PV UFCF | 34,244.0 | |||||||||
| Long Term Growth Rate, % | 2.00 | |||||||||
| Free cash flow (T + 1) | 11,876 | |||||||||
| Terminal Value | 248,784 | |||||||||
| Present Terminal Value | 179,266 | |||||||||
| Enterprise Value | 213,510 | |||||||||
| Net Debt | -1,620 | |||||||||
| Equity Value | 215,130 | |||||||||
| Diluted Shares Outstanding, MM | 1,349 | |||||||||
| Equity Value Per Share | 159.46 |
What You Will Receive
- Genuine HISENSE Financial Data: Pre-loaded with Hisense’s historical and projected figures for accurate analysis.
- Completely Customizable Template: Easily adjust key inputs such as revenue growth, WACC, and EBITDA percentage.
- Instant Calculations: Watch the intrinsic value of Hisense update in real-time based on your modifications.
- Expert Valuation Tool: Tailored for investors, analysts, and consultants aiming for reliable DCF outcomes.
- Intuitive Design: Straightforward layout and clear guidelines suited for users of all skill levels.
Key Features
- 🔍 Real-Life Hisense Financials: Pre-filled historical and projected data for Hisense Home Appliances Group Co., Ltd. (0921HK).
- ✏️ Fully Customizable Inputs: Modify essential parameters (yellow cells) such as WACC, growth %, and tax rates.
- 📊 Professional DCF Valuation: Integrated formulas compute Hisense's intrinsic value using the Discounted Cash Flow method.
- ⚡ Instant Results: See Hisense's valuation immediately after adjustments are made.
- Scenario Analysis: Evaluate and contrast outcomes for different financial assumptions side-by-side.
How It Works
- Download: Obtain the ready-to-use Excel file containing Hisense Home Appliances Group Co., Ltd.'s (0921HK) financial data.
- Customize: Modify projections, including sales growth, EBITDA margin, and WACC.
- Update Automatically: The intrinsic value and NPV calculations refresh in real-time.
- Test Scenarios: Develop various forecasts and compare results instantly.
- Make Decisions: Utilize the valuation insights to inform your investment strategy.
Why Opt for Hisense Home Appliances Group Co., Ltd. Calculator?
- All-in-One Solution: Integrates DCF, WACC, and financial ratio analyses seamlessly.
- Flexible Inputs: Modify the highlighted cells to explore different financial scenarios.
- In-Depth Analysis: Automatically computes the intrinsic value and Net Present Value for Hisense.
- Preloaded Information: Access historical and projected data for reliable analysis.
- High-Caliber Tool: Perfect for financial analysts, investors, and business advisors.
Who Can Benefit from This Product?
- Investors: Precisely assess the fair value of Hisense Home Appliances Group Co., Ltd. (0921HK) before making investment choices.
- Chief Financial Officers (CFOs): Utilize a high-quality DCF model for robust financial reporting and analysis.
- Consultants: Seamlessly modify the template for client valuation reports.
- Entrepreneurs: Learn financial modeling techniques utilized by leading companies in the industry.
- Educators: Employ it as an educational resource to illustrate valuation methods.
Overview of the Template Features
- Pre-Filled DCF Model: Hisense Home Appliances Group Co., Ltd.'s (0921HK) financial data ready for immediate analysis.
- WACC Calculator: Comprehensive calculations for the Weighted Average Cost of Capital.
- Financial Ratios: Assess profitability, leverage, and efficiency metrics for Hisense.
- Editable Inputs: Customize assumptions regarding growth, margins, and CAPEX according to your scenarios.
- Financial Statements: Access to annual and quarterly reports for in-depth analysis.
- Interactive Dashboard: Effortlessly visualize essential valuation metrics and outcomes.
Disclaimer
All information, articles, and product details provided on this website are for general informational and educational purposes only. We do not claim any ownership over, nor do we intend to infringe upon, any trademarks, copyrights, logos, brand names, or other intellectual property mentioned or depicted on this site. Such intellectual property remains the property of its respective owners, and any references here are made solely for identification or informational purposes, without implying any affiliation, endorsement, or partnership.
We make no representations or warranties, express or implied, regarding the accuracy, completeness, or suitability of any content or products presented. Nothing on this website should be construed as legal, tax, investment, financial, medical, or other professional advice. In addition, no part of this site—including articles or product references—constitutes a solicitation, recommendation, endorsement, advertisement, or offer to buy or sell any securities, franchises, or other financial instruments, particularly in jurisdictions where such activity would be unlawful.
All content is of a general nature and may not address the specific circumstances of any individual or entity. It is not a substitute for professional advice or services. Any actions you take based on the information provided here are strictly at your own risk. You accept full responsibility for any decisions or outcomes arising from your use of this website and agree to release us from any liability in connection with your use of, or reliance upon, the content or products found herein.