
|
Bucher Industries AG (0QQN.L) DCF تقييم |
Fully Editable: Tailor To Your Needs In Excel Or Sheets
Professional Design: Trusted, Industry-Standard Templates
Investor-Approved Valuation Models
MAC/PC Compatible, Fully Unlocked
No Expertise Is Needed; Easy To Follow
Bucher Industries AG (0QQN.L) Bundle
قم بتحسين وقتك وتحسين الدقة من خلال حاسبة DCF (0QQNL)! مزودة ببيانات Bucher Industries الحقيقية والافتراضات القابلة للتخصيص ، تمكنك هذه الأداة من التنبؤ وتحليل وقيمة Bucher Industries Ag مثل المستثمر الخبير.
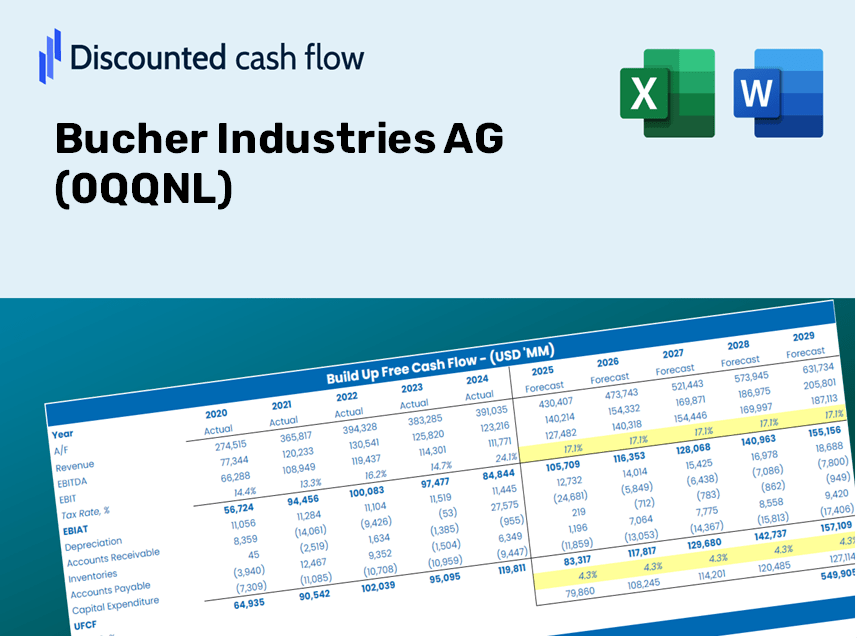
Discounted Cash Flow (DCF) - (USD MM)
| Year | AY1 2020 |
AY2 2021 |
AY3 2022 |
AY4 2023 |
AY5 2024 |
FY1 2025 |
FY2 2026 |
FY3 2027 |
FY4 2028 |
FY5 2029 |
|---|---|---|---|---|---|---|---|---|---|---|
| Revenue | 2,740.7 | 3,176.4 | 3,596.8 | 3,574.8 | 3,155.5 | 3,288.0 | 3,426.0 | 3,569.8 | 3,719.7 | 3,875.8 |
| Revenue Growth, % | 0 | 15.9 | 13.24 | -0.61165 | -11.73 | 4.2 | 4.2 | 4.2 | 4.2 | 4.2 |
| EBITDA | 286.5 | 437.7 | 503.5 | 522.8 | 385.5 | 427.9 | 445.9 | 464.6 | 484.1 | 504.4 |
| EBITDA, % | 10.45 | 13.78 | 14 | 14.62 | 12.22 | 13.01 | 13.01 | 13.01 | 13.01 | 13.01 |
| Depreciation | 83.2 | 84.7 | 79.7 | 86.0 | 92.0 | 87.1 | 90.7 | 94.5 | 98.5 | 102.6 |
| Depreciation, % | 3.04 | 2.67 | 2.22 | 2.41 | 2.92 | 2.65 | 2.65 | 2.65 | 2.65 | 2.65 |
| EBIT | 203.3 | 353.0 | 423.8 | 436.8 | 293.5 | 340.9 | 355.2 | 370.1 | 385.6 | 401.8 |
| EBIT, % | 7.42 | 11.11 | 11.78 | 12.22 | 9.3 | 10.37 | 10.37 | 10.37 | 10.37 | 10.37 |
| Total Cash | 551.1 | 705.6 | 579.3 | 529.3 | 432.7 | 571.8 | 595.8 | 620.8 | 646.8 | 674.0 |
| Total Cash, percent | .0 | .0 | .0 | .0 | .0 | .0 | .0 | .0 | .0 | .0 |
| Account Receivables | 460.7 | 497.7 | 630.6 | 532.8 | 463.4 | 523.4 | 545.4 | 568.3 | 592.2 | 617.0 |
| Account Receivables, % | 16.81 | 15.67 | 17.53 | 14.9 | 14.69 | 15.92 | 15.92 | 15.92 | 15.92 | 15.92 |
| Inventories | 695.0 | 856.1 | 1,034.7 | 1,056.3 | 948.9 | 925.2 | 964.1 | 1,004.5 | 1,046.7 | 1,090.6 |
| Inventories, % | 25.36 | 26.95 | 28.77 | 29.55 | 30.07 | 28.14 | 28.14 | 28.14 | 28.14 | 28.14 |
| Accounts Payable | 238.9 | 297.8 | 348.6 | 291.8 | 234.3 | 285.2 | 297.2 | 309.7 | 322.7 | 336.2 |
| Accounts Payable, % | 8.72 | 9.38 | 9.69 | 8.16 | 7.43 | 8.67 | 8.67 | 8.67 | 8.67 | 8.67 |
| Capital Expenditure | -72.2 | -73.5 | -97.0 | -141.6 | -152.2 | -108.0 | -112.6 | -117.3 | -122.2 | -127.4 |
| Capital Expenditure, % | -2.63 | -2.31 | -2.7 | -3.96 | -4.82 | -3.29 | -3.29 | -3.29 | -3.29 | -3.29 |
| Tax Rate, % | 21.98 | 21.98 | 21.98 | 21.98 | 21.98 | 21.98 | 21.98 | 21.98 | 21.98 | 21.98 |
| EBITAT | 153.6 | 267.9 | 333.6 | 352.3 | 229.0 | 265.1 | 276.2 | 287.8 | 299.9 | 312.5 |
| Depreciation | ||||||||||
| Changes in Account Receivables | ||||||||||
| Changes in Inventories | ||||||||||
| Changes in Accounts Payable | ||||||||||
| Capital Expenditure | ||||||||||
| UFCF | -752.2 | 139.9 | 55.6 | 316.1 | 288.1 | 258.7 | 205.5 | 214.2 | 223.1 | 232.5 |
| WACC, % | 8.74 | 8.74 | 8.74 | 8.75 | 8.74 | 8.74 | 8.74 | 8.74 | 8.74 | 8.74 |
| PV UFCF | ||||||||||
| SUM PV UFCF | 890.7 | |||||||||
| Long Term Growth Rate, % | 0.50 | |||||||||
| Free cash flow (T + 1) | 234 | |||||||||
| Terminal Value | 2,835 | |||||||||
| Present Terminal Value | 1,865 | |||||||||
| Enterprise Value | 2,755 | |||||||||
| Net Debt | -348 | |||||||||
| Equity Value | 3,104 | |||||||||
| Diluted Shares Outstanding, MM | 10 | |||||||||
| Equity Value Per Share | 303.24 |
ماذا ستتلقى
- مدخلات التنبؤ المرنة: تعديل الافتراضات الرئيسية (النمو ٪ ، الهوامش ، WACC) دون عناء لاستكشاف سيناريوهات مختلفة.
- بيانات العالم الحقيقي: البيانات المالية المملوءة مسبقًا من Bucher Industries AG (0QQNL) لبدء تحليلك.
- مخرجات DCF الآلية: يقوم القالب بحساب القيمة الحالية الصافية (NPV) والقيمة الجوهرية لك تلقائيًا.
- قابل للتخصيص والمهني: نموذج Excel متطور مصمم لتناسب متطلبات التقييم الخاصة بك.
- مصمم للمحللين والمستثمرين: مثالي لتقييم التوقعات ، والتحقق من الاستراتيجيات ، وتحسين الكفاءة.
الميزات الرئيسية
- 🔍 البيانات المالية الواقعية في الحياة: البيانات التاريخية والمتوقعة المليئة مسبقًا بـ Bucher Industries AG (0QQNL).
- ✏️ مدخلات قابلة للتخصيص بالكامل: اضبط جميع المعلمات الهامة (الخلايا الصفراء) مثل WACC و Growth ٪ ومعدلات الضرائب.
- 📊 تقييم DCF المهني: الصيغ المدمجة تحسب القيمة الجوهرية لـ Bucher باستخدام طريقة التدفق النقدي المخفض.
- ⚡ النتائج الفورية: تصور تقييم بوشر فور إجراء التعديلات.
- تحليل السيناريو: تقييم ومقارنة نتائج الافتراضات المالية المختلفة جنبًا إلى جنب.
كيف تعمل
- الخطوة 1: قم بتنزيل ملف Excel لـ Bucher Industries AG (0QQNL).
- الخطوة 2: فحص البيانات المالية المملوءة مسبقًا وتوقعات Bucher Industries AG (0QQNL).
- الخطوة 3: ضبط المدخلات الرئيسية مثل نمو الإيرادات ، WACC ، ومعدلات الضرائب (الخلايا المميزة).
- الخطوة 4: لاحظ كيف يتم تحديث نموذج DCF في الوقت الفعلي أثناء تعديل افتراضاتك.
- الخطوة 5: راجع المخرجات والاستفادة من النتائج لاستراتيجيات الاستثمار الخاصة بك.
لماذا حدد هذه الآلة الحاسبة لـ Bucher Industries AG (0QQNL)؟
- مصمم للخبراء: أداة متطورة يستخدمها المحللون والمدير المالي والمستشارون في الصناعة.
- بيانات شاملة: يتم تحميل البيانات المالية التاريخية والمتوقعة في Bucher AG للتحليل الدقيق.
- تحليل السيناريو: اختبار دون عناء التنبؤات والافتراضات.
- مقاييس واضحة: يحسب تلقائيًا القيمة الجوهرية ، NPV ، والمقاييس الأساسية الأخرى.
- سهل الاستخدام: سوف تقودك إرشادات خطوة بخطوة خلال كل مرحلة من مراحل الحساب.
من الذي يمكن أن يستفيد من هذا المنتج؟
- المستثمرون: تقييم تقييم Bucher Industries AG (0QQNL) قبل اتخاذ قرارات الاستثمار.
- الماليين والمحللين الماليين: تحسين سير عمل التقييم والتحقق من صحة التوقعات المالية.
- مؤسسو الشركات الناشئة: اكتساب رؤى حول كيفية تقدير الشركات الرائدة في الشركات العامة مثل Bucher Industries AG (0QQNL).
- الاستشاريون: إنتاج تقارير تقييم شاملة لعملائك.
- الطلاب والمعلمين: الاستفادة من البيانات الحقيقية لممارسة وتوجيه منهجيات التقييم.
محتويات القالب
- نموذج DCF المليء مسبقًا: Bucher Industries AG البيانات المالية المسبقة للاستخدام الفوري.
- حاسبة WACC: حسابات شاملة لمتوسط تكلفة رأس المال المرجح.
- النسب المالية: تقييم ربحية Bucher Industries AG والرافعة المالية والكفاءة.
- مدخلات قابلة للتحرير: تخصيص الافتراضات مثل معدلات النمو والهوامش و Capex لسيناريوهاتك المحددة.
- البيانات المالية: تقارير سنوية وفصلية لتسهيل التحليل الشامل.
- لوحة القيادة التفاعلية: تصور دون عناء مقاييس التقييم الرئيسية والنتائج.
Disclaimer
All information, articles, and product details provided on this website are for general informational and educational purposes only. We do not claim any ownership over, nor do we intend to infringe upon, any trademarks, copyrights, logos, brand names, or other intellectual property mentioned or depicted on this site. Such intellectual property remains the property of its respective owners, and any references here are made solely for identification or informational purposes, without implying any affiliation, endorsement, or partnership.
We make no representations or warranties, express or implied, regarding the accuracy, completeness, or suitability of any content or products presented. Nothing on this website should be construed as legal, tax, investment, financial, medical, or other professional advice. In addition, no part of this site—including articles or product references—constitutes a solicitation, recommendation, endorsement, advertisement, or offer to buy or sell any securities, franchises, or other financial instruments, particularly in jurisdictions where such activity would be unlawful.
All content is of a general nature and may not address the specific circumstances of any individual or entity. It is not a substitute for professional advice or services. Any actions you take based on the information provided here are strictly at your own risk. You accept full responsibility for any decisions or outcomes arising from your use of this website and agree to release us from any liability in connection with your use of, or reliance upon, the content or products found herein.