
|
Bucher Industries AG (0qqn.l) Valoración de DCF |
Completamente Editable: Adáptelo A Sus Necesidades En Excel O Sheets
Diseño Profesional: Plantillas Confiables Y Estándares De La Industria
Predeterminadas Para Un Uso Rápido Y Eficiente
Compatible con MAC / PC, completamente desbloqueado
No Se Necesita Experiencia; Fáciles De Seguir
Bucher Industries AG (0QQN.L) Bundle
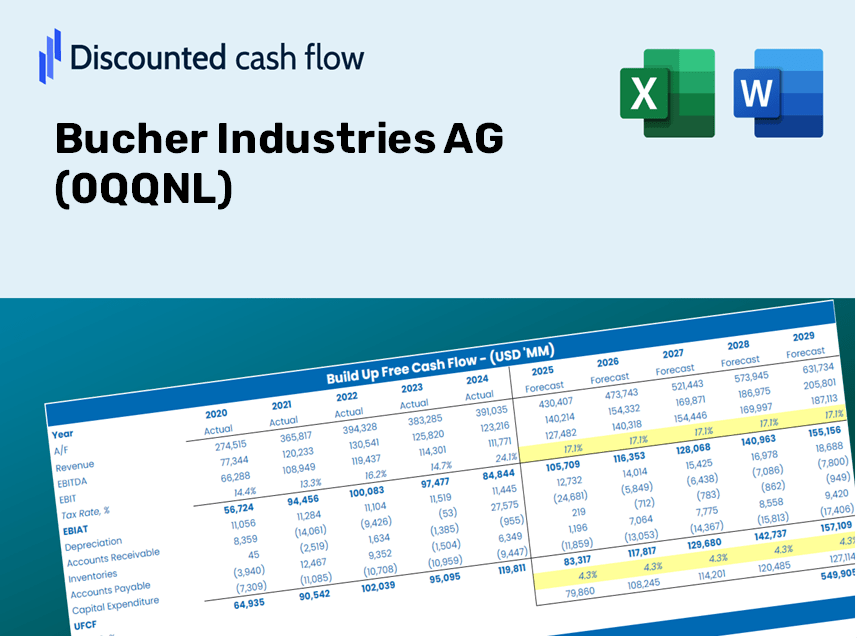
¡Optimice su tiempo y mejore la precisión con nuestra calculadora DCF (0qqnl)! Equipado con datos Real Bucher Industries AG y supuestos personalizables, esta herramienta le permite pronosticar, analizar y valorar Bucher Industries AG como un inversor experto.
Discounted Cash Flow (DCF) - (USD MM)
| Year | AY1 2020 |
AY2 2021 |
AY3 2022 |
AY4 2023 |
AY5 2024 |
FY1 2025 |
FY2 2026 |
FY3 2027 |
FY4 2028 |
FY5 2029 |
|---|---|---|---|---|---|---|---|---|---|---|
| Revenue | 2,740.7 | 3,176.4 | 3,596.8 | 3,574.8 | 3,155.5 | 3,288.0 | 3,426.0 | 3,569.8 | 3,719.7 | 3,875.8 |
| Revenue Growth, % | 0 | 15.9 | 13.24 | -0.61165 | -11.73 | 4.2 | 4.2 | 4.2 | 4.2 | 4.2 |
| EBITDA | 286.5 | 437.7 | 503.5 | 522.8 | 385.5 | 427.9 | 445.9 | 464.6 | 484.1 | 504.4 |
| EBITDA, % | 10.45 | 13.78 | 14 | 14.62 | 12.22 | 13.01 | 13.01 | 13.01 | 13.01 | 13.01 |
| Depreciation | 83.2 | 84.7 | 79.7 | 86.0 | 92.0 | 87.1 | 90.7 | 94.5 | 98.5 | 102.6 |
| Depreciation, % | 3.04 | 2.67 | 2.22 | 2.41 | 2.92 | 2.65 | 2.65 | 2.65 | 2.65 | 2.65 |
| EBIT | 203.3 | 353.0 | 423.8 | 436.8 | 293.5 | 340.9 | 355.2 | 370.1 | 385.6 | 401.8 |
| EBIT, % | 7.42 | 11.11 | 11.78 | 12.22 | 9.3 | 10.37 | 10.37 | 10.37 | 10.37 | 10.37 |
| Total Cash | 551.1 | 705.6 | 579.3 | 529.3 | 432.7 | 571.8 | 595.8 | 620.8 | 646.8 | 674.0 |
| Total Cash, percent | .0 | .0 | .0 | .0 | .0 | .0 | .0 | .0 | .0 | .0 |
| Account Receivables | 460.7 | 497.7 | 630.6 | 532.8 | 463.4 | 523.4 | 545.4 | 568.3 | 592.2 | 617.0 |
| Account Receivables, % | 16.81 | 15.67 | 17.53 | 14.9 | 14.69 | 15.92 | 15.92 | 15.92 | 15.92 | 15.92 |
| Inventories | 695.0 | 856.1 | 1,034.7 | 1,056.3 | 948.9 | 925.2 | 964.1 | 1,004.5 | 1,046.7 | 1,090.6 |
| Inventories, % | 25.36 | 26.95 | 28.77 | 29.55 | 30.07 | 28.14 | 28.14 | 28.14 | 28.14 | 28.14 |
| Accounts Payable | 238.9 | 297.8 | 348.6 | 291.8 | 234.3 | 285.2 | 297.2 | 309.7 | 322.7 | 336.2 |
| Accounts Payable, % | 8.72 | 9.38 | 9.69 | 8.16 | 7.43 | 8.67 | 8.67 | 8.67 | 8.67 | 8.67 |
| Capital Expenditure | -72.2 | -73.5 | -97.0 | -141.6 | -152.2 | -108.0 | -112.6 | -117.3 | -122.2 | -127.4 |
| Capital Expenditure, % | -2.63 | -2.31 | -2.7 | -3.96 | -4.82 | -3.29 | -3.29 | -3.29 | -3.29 | -3.29 |
| Tax Rate, % | 21.98 | 21.98 | 21.98 | 21.98 | 21.98 | 21.98 | 21.98 | 21.98 | 21.98 | 21.98 |
| EBITAT | 153.6 | 267.9 | 333.6 | 352.3 | 229.0 | 265.1 | 276.2 | 287.8 | 299.9 | 312.5 |
| Depreciation | ||||||||||
| Changes in Account Receivables | ||||||||||
| Changes in Inventories | ||||||||||
| Changes in Accounts Payable | ||||||||||
| Capital Expenditure | ||||||||||
| UFCF | -752.2 | 139.9 | 55.6 | 316.1 | 288.1 | 258.7 | 205.5 | 214.2 | 223.1 | 232.5 |
| WACC, % | 8.1 | 8.1 | 8.1 | 8.1 | 8.1 | 8.1 | 8.1 | 8.1 | 8.1 | 8.1 |
| PV UFCF | ||||||||||
| SUM PV UFCF | 905.6 | |||||||||
| Long Term Growth Rate, % | 0.50 | |||||||||
| Free cash flow (T + 1) | 234 | |||||||||
| Terminal Value | 3,074 | |||||||||
| Present Terminal Value | 2,082 | |||||||||
| Enterprise Value | 2,988 | |||||||||
| Net Debt | -348 | |||||||||
| Equity Value | 3,336 | |||||||||
| Diluted Shares Outstanding, MM | 10 | |||||||||
| Equity Value Per Share | 325.95 |
What You Will Receive
- Flexible Forecast Inputs: Modify key assumptions (growth %, margins, WACC) effortlessly to explore various scenarios.
- Real-World Data: Pre-filled financial data from Bucher Industries AG (0QQNL) to kickstart your analysis.
- Automated DCF Outputs: The template calculates Net Present Value (NPV) and intrinsic value for you automatically.
- Customizable and Professional: A sophisticated Excel model tailored to suit your valuation requirements.
- Designed for Analysts and Investors: Perfect for assessing projections, validating strategies, and improving efficiency.
Key Features
- 🔍 Real-Life BUCH Financials: Pre-filled historical and projected data for Bucher Industries AG (0QQNL).
- ✏️ Fully Customizable Inputs: Adjust all critical parameters (yellow cells) such as WACC, growth %, and tax rates.
- 📊 Professional DCF Valuation: Built-in formulas calculate Bucher’s intrinsic value using the Discounted Cash Flow method.
- ⚡ Instant Results: Visualize Bucher’s valuation immediately after making adjustments.
- Scenario Analysis: Evaluate and compare outcomes for different financial assumptions side-by-side.
How It Works
- Step 1: Download the Excel file for Bucher Industries AG (0QQNL).
- Step 2: Examine the pre-filled financial data and forecasts for Bucher Industries AG (0QQNL).
- Step 3: Adjust key inputs such as revenue growth, WACC, and tax rates (highlighted cells).
- Step 4: Observe how the DCF model updates in real-time as you modify your assumptions.
- Step 5: Review the outputs and leverage the results for your investment strategies.
Why Select This Calculator for Bucher Industries AG (0QQNL)?
- Designed for Experts: A sophisticated tool utilized by analysts, CFOs, and consultants in the industry.
- Comprehensive Data: Bucher Industries AG's historical and projected financials are preloaded for precise analysis.
- Scenario Analysis: Effortlessly test various forecasts and assumptions.
- Clear Metrics: Automatically computes intrinsic value, NPV, and other essential metrics.
- User-Friendly: Step-by-step instructions will lead you through each phase of the calculation.
Who Could Benefit from This Product?
- Investors: Evaluate Bucher Industries AG’s (0QQNL) valuation prior to making investment decisions.
- CFOs and Financial Analysts: Optimize valuation workflows and validate financial projections.
- Startup Founders: Gain insights into how leading public firms like Bucher Industries AG (0QQNL) are valued.
- Consultants: Produce comprehensive valuation reports for your clients.
- Students and Educators: Utilize real data to practice and instruct on valuation methodologies.
Contents of the Template
- Pre-Filled DCF Model: Bucher Industries AG’s financial data preloaded for immediate use.
- WACC Calculator: Comprehensive calculations for the Weighted Average Cost of Capital.
- Financial Ratios: Assess Bucher Industries AG’s profitability, leverage, and efficiency.
- Editable Inputs: Customize assumptions such as growth rates, margins, and CAPEX for your specific scenarios.
- Financial Statements: Annual and quarterly reports to facilitate thorough analysis.
- Interactive Dashboard: Effortlessly visualize key valuation metrics and outcomes.
Disclaimer
All information, articles, and product details provided on this website are for general informational and educational purposes only. We do not claim any ownership over, nor do we intend to infringe upon, any trademarks, copyrights, logos, brand names, or other intellectual property mentioned or depicted on this site. Such intellectual property remains the property of its respective owners, and any references here are made solely for identification or informational purposes, without implying any affiliation, endorsement, or partnership.
We make no representations or warranties, express or implied, regarding the accuracy, completeness, or suitability of any content or products presented. Nothing on this website should be construed as legal, tax, investment, financial, medical, or other professional advice. In addition, no part of this site—including articles or product references—constitutes a solicitation, recommendation, endorsement, advertisement, or offer to buy or sell any securities, franchises, or other financial instruments, particularly in jurisdictions where such activity would be unlawful.
All content is of a general nature and may not address the specific circumstances of any individual or entity. It is not a substitute for professional advice or services. Any actions you take based on the information provided here are strictly at your own risk. You accept full responsibility for any decisions or outcomes arising from your use of this website and agree to release us from any liability in connection with your use of, or reliance upon, the content or products found herein.