
|
Pal Group Holdings Co. ، Ltd. (2726.T) تقييم DCF |
Fully Editable: Tailor To Your Needs In Excel Or Sheets
Professional Design: Trusted, Industry-Standard Templates
Investor-Approved Valuation Models
MAC/PC Compatible, Fully Unlocked
No Expertise Is Needed; Easy To Follow
PAL GROUP Holdings CO., LTD. (2726.T) Bundle
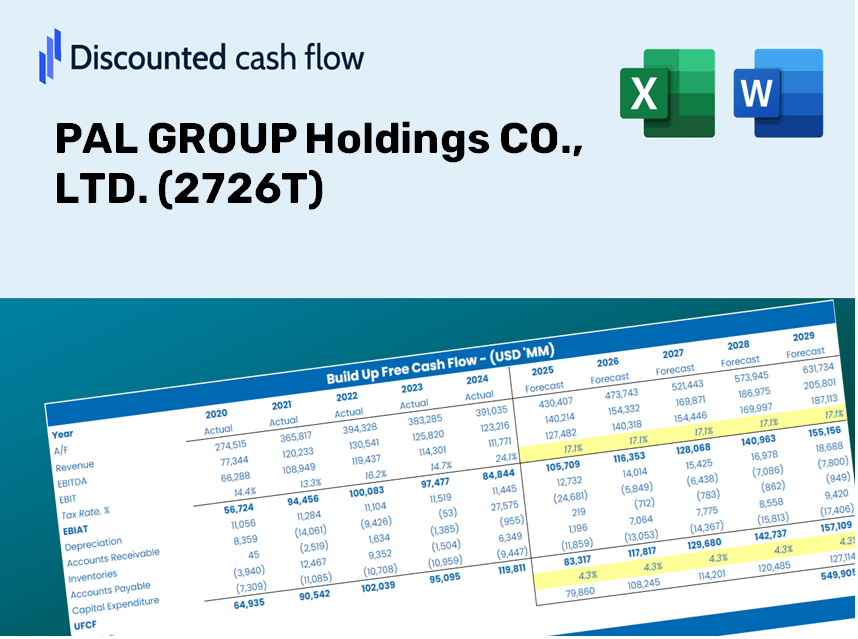
استكشاف الآفاق المالية لشركة Pal Group Holdings Co. ، Ltd. (2726T) مع حاسبة DCF سهلة الاستخدام لدينا! أدخل افتراضاتك المتعلقة بالنمو والهوامش والمصروفات لحساب القيمة الجوهرية لشركة Pal Group Holdings Co. ، Ltd. (2726T) وصقل استراتيجيتك الاستثمارية.
Discounted Cash Flow (DCF) - (USD MM)
| Year | AY1 2020 |
AY2 2021 |
AY3 2022 |
AY4 2023 |
AY5 2024 |
FY1 2025 |
FY2 2026 |
FY3 2027 |
FY4 2028 |
FY5 2029 |
|---|---|---|---|---|---|---|---|---|---|---|
| Revenue | 108,522.0 | 134,200.0 | 164,482.0 | 192,544.0 | 207,825.0 | 244,830.1 | 288,424.3 | 339,780.8 | 400,281.9 | 471,555.7 |
| Revenue Growth, % | 0 | 23.66 | 22.56 | 17.06 | 7.94 | 17.81 | 17.81 | 17.81 | 17.81 | 17.81 |
| EBITDA | 2,536.0 | 7,950.0 | 17,364.0 | 20,588.0 | 22,810.0 | 19,824.3 | 23,354.2 | 27,512.6 | 32,411.5 | 38,182.6 |
| EBITDA, % | 2.34 | 5.92 | 10.56 | 10.69 | 10.98 | 8.1 | 8.1 | 8.1 | 8.1 | 8.1 |
| Depreciation | 1,914.0 | 1,774.0 | 2,045.0 | 2,262.0 | 2,525.0 | 3,289.9 | 3,875.7 | 4,565.7 | 5,378.7 | 6,336.4 |
| Depreciation, % | 1.76 | 1.32 | 1.24 | 1.17 | 1.21 | 1.34 | 1.34 | 1.34 | 1.34 | 1.34 |
| EBIT | 622.0 | 6,176.0 | 15,319.0 | 18,326.0 | 20,285.0 | 16,534.4 | 19,478.5 | 22,946.9 | 27,032.8 | 31,846.2 |
| EBIT, % | 0.57316 | 4.6 | 9.31 | 9.52 | 9.76 | 6.75 | 6.75 | 6.75 | 6.75 | 6.75 |
| Total Cash | 63,088.0 | 52,250.0 | 63,845.0 | 67,228.0 | 85,715.0 | 103,829.3 | 122,317.0 | 144,096.7 | 169,754.4 | 199,980.7 |
| Total Cash, percent | .0 | .0 | .0 | .0 | .0 | .0 | .0 | .0 | .0 | .0 |
| Account Receivables | 7,310.0 | 6,342.0 | 8,553.0 | 10,373.0 | 10,467.0 | 13,262.7 | 15,624.2 | 18,406.3 | 21,683.7 | 25,544.6 |
| Account Receivables, % | 6.74 | 4.73 | 5.2 | 5.39 | 5.04 | 5.42 | 5.42 | 5.42 | 5.42 | 5.42 |
| Inventories | 9,740.0 | 10,766.0 | 12,541.0 | 16,523.0 | 16,743.0 | 20,203.3 | 23,800.6 | 28,038.5 | 33,031.1 | 38,912.5 |
| Inventories, % | 8.98 | 8.02 | 7.62 | 8.58 | 8.06 | 8.25 | 8.25 | 8.25 | 8.25 | 8.25 |
| Accounts Payable | 24,688.0 | 20,366.0 | 24,335.0 | 28,845.0 | 29,252.0 | 40,042.6 | 47,172.6 | 55,572.1 | 65,467.2 | 77,124.2 |
| Accounts Payable, % | 22.75 | 15.18 | 14.79 | 14.98 | 14.08 | 16.36 | 16.36 | 16.36 | 16.36 | 16.36 |
| Capital Expenditure | -1,831.0 | -1,639.0 | -2,479.0 | -3,166.0 | -2,884.0 | -3,646.8 | -4,296.2 | -5,061.2 | -5,962.3 | -7,024.0 |
| Capital Expenditure, % | -1.69 | -1.22 | -1.51 | -1.64 | -1.39 | -1.49 | -1.49 | -1.49 | -1.49 | -1.49 |
| Tax Rate, % | 41.24 | 41.24 | 41.24 | 41.24 | 41.24 | 41.24 | 41.24 | 41.24 | 41.24 | 41.24 |
| EBITAT | 333.2 | 4,070.9 | 10,013.8 | 12,906.3 | 11,918.9 | 10,384.9 | 12,234.0 | 14,412.4 | 16,978.6 | 20,001.8 |
| Depreciation | ||||||||||
| Changes in Account Receivables | ||||||||||
| Changes in Inventories | ||||||||||
| Changes in Accounts Payable | ||||||||||
| Capital Expenditure | ||||||||||
| UFCF | 8,054.2 | -174.1 | 9,562.8 | 10,710.3 | 11,652.9 | 14,562.6 | 12,984.5 | 15,296.5 | 18,020.2 | 21,228.8 |
| WACC, % | 5.3 | 5.32 | 5.32 | 5.33 | 5.31 | 5.31 | 5.31 | 5.31 | 5.31 | 5.31 |
| PV UFCF | ||||||||||
| SUM PV UFCF | 69,666.0 | |||||||||
| Long Term Growth Rate, % | 0.50 | |||||||||
| Free cash flow (T + 1) | 21,335 | |||||||||
| Terminal Value | 443,146 | |||||||||
| Present Terminal Value | 342,064 | |||||||||
| Enterprise Value | 411,730 | |||||||||
| Net Debt | -71,520 | |||||||||
| Equity Value | 483,250 | |||||||||
| Diluted Shares Outstanding, MM | 174 | |||||||||
| Equity Value Per Share | 2,782.95 |
الفوائد التي ستتلقاها
- PAL Group Financial: يقدم بيانات تاريخية ومتوقعة شاملة للتقييم الدقيق.
- المعلمات القابلة للتخصيص: اضبط WACC ومعدلات الضرائب ونمو الإيرادات والنفقات الرأسمالية حسب الحاجة.
- الحسابات الفورية: يتم حساب القيمة الجوهرية و NPV في الوقت الفعلي.
- اختبار السيناريو: استكشف السيناريوهات المختلفة لتقييم الأداء المستقبلي لمجموعة PAL.
- واجهة سهلة الاستخدام: مصمم للخبراء مع بقاء ودودين للقادمين الجدد.
الميزات الأساسية
- حاسبة DCF شاملة: تقدم أطراف تقييم DCF غير العمق والرافعة.
- حاسبة WACC: متوسط تكلفة متوسط تكلفة القالب الرأسمالي مع المعلمات القابلة للتعديل.
- افتراضات التنبؤ القابلة للتخصيص: ضبط توقعات النمو والنفقات الرأسمالية ومعدلات الخصم حسب الحاجة.
- النسب المالية المتكاملة: تقييم مقاييس الربحية والرافعة المالية والكفاءة لشركة PAL Group Holdings Co. ، Ltd. (2726T).
- لوحة القيادة التفاعلية والصور: تمثل التمثيلات الرسومية مؤشرات التقييم الأساسية للتقييم المباشر.
كيف تعمل
- الخطوة 1: قم بتنزيل قالب Excel Prebuilt الذي يضم Pal Group Holdings Co. ، Ltd. (2726T) البيانات.
- الخطوة 2: راجع الأوراق المملوءة مسبقًا للتعرف على المقاييس الأساسية.
- الخطوة 3: تعديل التنبؤات والافتراضات في الخلايا الصفراء القابلة للتحرير (WACC ، النمو ، الهوامش).
- الخطوة 4: عرض النتائج المحدثة على الفور ، بما في ذلك القيمة الجوهرية لشركة PAL Group Holdings Co. ، Ltd. (2726T).
- الخطوة 5: استخدم المخرجات لاتخاذ قرارات استثمارية مستنيرة أو إنشاء تقارير.
لماذا تختار شركة Pal Group Holdings Co. ، Ltd. (2726T) الآلة الحاسبة؟
- فعال الوقت: تخطي متاعب بناء نموذج DCF من الألف إلى الياء - إنه جاهز للاستخدام الفوري.
- الدقة المعززة: البيانات المالية التي يمكن الاعتماد عليها تقلل من أخطاء التقييم.
- قابلة للتخصيص تماما: اضبط النموذج للتوافق مع افتراضاتك والتوقعات المحددة.
- رؤى سهلة الاستخدام: المخططات والمخرجات البديهية تبسيط تفسير النتائج.
- خبير معتمد: تم تصميمه للمهنيين الذين يعطون الأولوية للدقة وسهولة الاستخدام.
من يمكنه الاستفادة من هذا المنتج؟
- طلاب التمويل: منهجيات التقييم الرئيسية وتطبيقها مع بيانات السوق الفعلية.
- الباحثون: دمج النماذج المعيارية للصناعة في محاضراتك أو دراساتك.
- المستثمرون: تقييم استراتيجياتك وتقييم نتائج التقييم لشركة PAL Group Holdings Co. ، Ltd. (2726T).
- المحللون الماليون: عزز كفاءتك من خلال نموذج DCF قابل للتخصيص مصمم لاحتياجاتك.
- رواد الأعمال: اكتشف كيف يتم تقييم الشركات العامة الرئيسية مثل Pal Group Holdings في السوق.
ما يحتويه القالب
- البيانات التاريخية: ميزات Pal Group Holdings Co. ، Ltd. الأداء المالي السابق والتوقعات التأسيسية.
- نماذج DCF و Ruvered DCF: قوالب شاملة لتقييم القيمة الجوهرية لشركة Pal Group Holdings Co. ، Ltd. (2726T).
- ورقة WACC: الحسابات المسببة للتشكيل لمتوسط تكلفة رأس المال المرجح.
- مدخلات قابلة للتحرير: ضبط العوامل الحاسمة مثل معدلات النمو ، والنسب المئوية EBITDA ، وتوقعات CAPEX.
- البيانات الفصلية والسنوية: انهيار مكثف لشركة Pal Group Holdings Co. ، Ltd.
- لوحة القيادة التفاعلية: التصور الديناميكي لنتائج التقييم والتوقعات.
Disclaimer
All information, articles, and product details provided on this website are for general informational and educational purposes only. We do not claim any ownership over, nor do we intend to infringe upon, any trademarks, copyrights, logos, brand names, or other intellectual property mentioned or depicted on this site. Such intellectual property remains the property of its respective owners, and any references here are made solely for identification or informational purposes, without implying any affiliation, endorsement, or partnership.
We make no representations or warranties, express or implied, regarding the accuracy, completeness, or suitability of any content or products presented. Nothing on this website should be construed as legal, tax, investment, financial, medical, or other professional advice. In addition, no part of this site—including articles or product references—constitutes a solicitation, recommendation, endorsement, advertisement, or offer to buy or sell any securities, franchises, or other financial instruments, particularly in jurisdictions where such activity would be unlawful.
All content is of a general nature and may not address the specific circumstances of any individual or entity. It is not a substitute for professional advice or services. Any actions you take based on the information provided here are strictly at your own risk. You accept full responsibility for any decisions or outcomes arising from your use of this website and agree to release us from any liability in connection with your use of, or reliance upon, the content or products found herein.