
|
Pal Group Holdings CO., Ltd. (2726.T) Évaluation DCF |
Entièrement Modifiable: Adapté À Vos Besoins Dans Excel Ou Sheets
Conception Professionnelle: Modèles Fiables Et Conformes Aux Normes Du Secteur
Pré-Construits Pour Une Utilisation Rapide Et Efficace
Compatible MAC/PC, entièrement débloqué
Aucune Expertise N'Est Requise; Facile À Suivre
PAL GROUP Holdings CO., LTD. (2726.T) Bundle
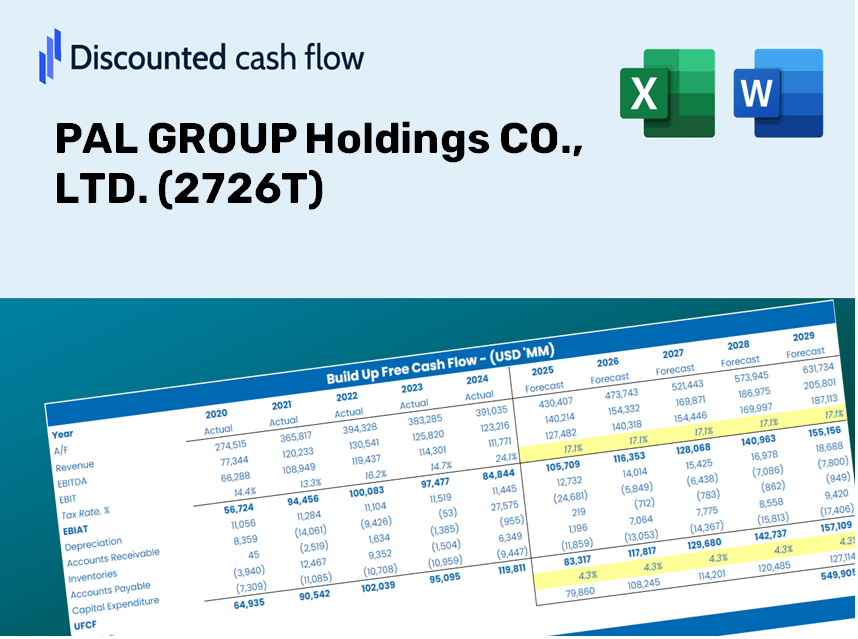
Explorez les perspectives financières de Pal Group Holdings CO., Ltd. (2726T) avec notre calculatrice DCF conviviale! Entrez vos hypothèses concernant la croissance, les marges et les dépenses pour calculer la valeur intrinsèque de PAL Group Holdings CO., Ltd. (2726t) et affiner votre stratégie d'investissement.
Discounted Cash Flow (DCF) - (USD MM)
| Year | AY1 2020 |
AY2 2021 |
AY3 2022 |
AY4 2023 |
AY5 2024 |
FY1 2025 |
FY2 2026 |
FY3 2027 |
FY4 2028 |
FY5 2029 |
|---|---|---|---|---|---|---|---|---|---|---|
| Revenue | 108,522.0 | 134,200.0 | 164,482.0 | 192,544.0 | 207,825.0 | 244,830.1 | 288,424.3 | 339,780.8 | 400,281.9 | 471,555.7 |
| Revenue Growth, % | 0 | 23.66 | 22.56 | 17.06 | 7.94 | 17.81 | 17.81 | 17.81 | 17.81 | 17.81 |
| EBITDA | 2,536.0 | 7,950.0 | 17,364.0 | 20,588.0 | 22,810.0 | 19,824.3 | 23,354.2 | 27,512.6 | 32,411.5 | 38,182.6 |
| EBITDA, % | 2.34 | 5.92 | 10.56 | 10.69 | 10.98 | 8.1 | 8.1 | 8.1 | 8.1 | 8.1 |
| Depreciation | 1,914.0 | 1,774.0 | 2,045.0 | 2,262.0 | 2,525.0 | 3,289.9 | 3,875.7 | 4,565.7 | 5,378.7 | 6,336.4 |
| Depreciation, % | 1.76 | 1.32 | 1.24 | 1.17 | 1.21 | 1.34 | 1.34 | 1.34 | 1.34 | 1.34 |
| EBIT | 622.0 | 6,176.0 | 15,319.0 | 18,326.0 | 20,285.0 | 16,534.4 | 19,478.5 | 22,946.9 | 27,032.8 | 31,846.2 |
| EBIT, % | 0.57316 | 4.6 | 9.31 | 9.52 | 9.76 | 6.75 | 6.75 | 6.75 | 6.75 | 6.75 |
| Total Cash | 63,088.0 | 52,250.0 | 63,845.0 | 67,228.0 | 85,715.0 | 103,829.3 | 122,317.0 | 144,096.7 | 169,754.4 | 199,980.7 |
| Total Cash, percent | .0 | .0 | .0 | .0 | .0 | .0 | .0 | .0 | .0 | .0 |
| Account Receivables | 7,310.0 | 6,342.0 | 8,553.0 | 10,373.0 | 10,467.0 | 13,262.7 | 15,624.2 | 18,406.3 | 21,683.7 | 25,544.6 |
| Account Receivables, % | 6.74 | 4.73 | 5.2 | 5.39 | 5.04 | 5.42 | 5.42 | 5.42 | 5.42 | 5.42 |
| Inventories | 9,740.0 | 10,766.0 | 12,541.0 | 16,523.0 | 16,743.0 | 20,203.3 | 23,800.6 | 28,038.5 | 33,031.1 | 38,912.5 |
| Inventories, % | 8.98 | 8.02 | 7.62 | 8.58 | 8.06 | 8.25 | 8.25 | 8.25 | 8.25 | 8.25 |
| Accounts Payable | 24,688.0 | 20,366.0 | 24,335.0 | 28,845.0 | 29,252.0 | 40,042.6 | 47,172.6 | 55,572.1 | 65,467.2 | 77,124.2 |
| Accounts Payable, % | 22.75 | 15.18 | 14.79 | 14.98 | 14.08 | 16.36 | 16.36 | 16.36 | 16.36 | 16.36 |
| Capital Expenditure | -1,831.0 | -1,639.0 | -2,479.0 | -3,166.0 | -2,884.0 | -3,646.8 | -4,296.2 | -5,061.2 | -5,962.3 | -7,024.0 |
| Capital Expenditure, % | -1.69 | -1.22 | -1.51 | -1.64 | -1.39 | -1.49 | -1.49 | -1.49 | -1.49 | -1.49 |
| Tax Rate, % | 41.24 | 41.24 | 41.24 | 41.24 | 41.24 | 41.24 | 41.24 | 41.24 | 41.24 | 41.24 |
| EBITAT | 333.2 | 4,070.9 | 10,013.8 | 12,906.3 | 11,918.9 | 10,384.9 | 12,234.0 | 14,412.4 | 16,978.6 | 20,001.8 |
| Depreciation | ||||||||||
| Changes in Account Receivables | ||||||||||
| Changes in Inventories | ||||||||||
| Changes in Accounts Payable | ||||||||||
| Capital Expenditure | ||||||||||
| UFCF | 8,054.2 | -174.1 | 9,562.8 | 10,710.3 | 11,652.9 | 14,562.6 | 12,984.5 | 15,296.5 | 18,020.2 | 21,228.8 |
| WACC, % | 5.33 | 5.35 | 5.35 | 5.35 | 5.34 | 5.34 | 5.34 | 5.34 | 5.34 | 5.34 |
| PV UFCF | ||||||||||
| SUM PV UFCF | 69,608.4 | |||||||||
| Long Term Growth Rate, % | 0.50 | |||||||||
| Free cash flow (T + 1) | 21,335 | |||||||||
| Terminal Value | 440,585 | |||||||||
| Present Terminal Value | 339,636 | |||||||||
| Enterprise Value | 409,244 | |||||||||
| Net Debt | -71,520 | |||||||||
| Equity Value | 480,764 | |||||||||
| Diluted Shares Outstanding, MM | 174 | |||||||||
| Equity Value Per Share | 2,768.64 |
Benefits You Will Receive
- Authentic PAL GROUP Financials: Offers comprehensive historical and projected data for precise valuation.
- Customizable Parameters: Adjust WACC, tax rates, revenue growth, and capital expenditures as needed.
- Instant Calculations: Intrinsic value and NPV are computed in real-time.
- Scenario Testing: Explore various scenarios to assess PAL GROUP’s future performance.
- user-Friendly Interface: Designed for experts while remaining approachable for newcomers.
Core Features
- Comprehensive DCF Calculator: Offers in-depth unlevered and levered DCF valuation frameworks.
- WACC Calculator: Ready-to-use Weighted Average Cost of Capital template with adjustable parameters.
- Customizable Forecast Assumptions: Adjust growth projections, capital expenditures, and discount rates as needed.
- Integrated Financial Ratios: Assess profitability, leverage, and efficiency metrics for PAL GROUP Holdings CO., LTD. (2726T).
- Interactive Dashboard and Visuals: Graphical representations highlight essential valuation indicators for straightforward evaluation.
How It Works
- Step 1: Download the prebuilt Excel template featuring PAL GROUP Holdings CO., LTD. (2726T) data.
- Step 2: Review the pre-filled sheets to familiarize yourself with the essential metrics.
- Step 3: Modify forecasts and assumptions in the editable yellow cells (WACC, growth, margins).
- Step 4: Instantly view updated results, including the intrinsic value of PAL GROUP Holdings CO., LTD. (2726T).
- Step 5: Use the outputs to make well-informed investment decisions or create reports.
Why Choose the PAL GROUP Holdings CO., LTD. (2726T) Calculator?
- Time-Efficient: Skip the hassle of building a DCF model from the ground up – it’s ready for immediate use.
- Enhanced Accuracy: Dependable financial data and formulas minimize valuation errors.
- Completely Customizable: Adjust the model to align with your specific assumptions and forecasts.
- User-Friendly Insights: Intuitive charts and outputs simplify result interpretation.
- Expert Approved: Crafted for professionals who prioritize accuracy and ease of use.
Who Can Benefit from This Product?
- Finance Students: Master valuation methodologies and apply them with actual market data.
- Researchers: Integrate industry-standard models into your lectures or studies.
- Investors: Assess your strategies and evaluate valuation results for PAL GROUP Holdings CO., LTD. (2726T).
- Financial Analysts: Enhance your efficiency with a customizable DCF model designed for your needs.
- Entrepreneurs: Discover how major public firms like PAL GROUP Holdings are evaluated in the market.
What the Template Contains
- Historical Data: Features PAL GROUP Holdings CO., LTD.’s past financial performance and foundational forecasts.
- DCF and Levered DCF Models: Comprehensive templates to assess the intrinsic value of PAL GROUP Holdings CO., LTD. (2726T).
- WACC Sheet: Pre-configured calculations for the Weighted Average Cost of Capital.
- Editable Inputs: Adjust crucial factors such as growth rates, EBITDA percentages, and CAPEX projections.
- Quarterly and Annual Statements: An extensive breakdown of PAL GROUP Holdings CO., LTD.’s financial data.
- Interactive Dashboard: Dynamic visualization of valuation outcomes and forecasts.
Disclaimer
All information, articles, and product details provided on this website are for general informational and educational purposes only. We do not claim any ownership over, nor do we intend to infringe upon, any trademarks, copyrights, logos, brand names, or other intellectual property mentioned or depicted on this site. Such intellectual property remains the property of its respective owners, and any references here are made solely for identification or informational purposes, without implying any affiliation, endorsement, or partnership.
We make no representations or warranties, express or implied, regarding the accuracy, completeness, or suitability of any content or products presented. Nothing on this website should be construed as legal, tax, investment, financial, medical, or other professional advice. In addition, no part of this site—including articles or product references—constitutes a solicitation, recommendation, endorsement, advertisement, or offer to buy or sell any securities, franchises, or other financial instruments, particularly in jurisdictions where such activity would be unlawful.
All content is of a general nature and may not address the specific circumstances of any individual or entity. It is not a substitute for professional advice or services. Any actions you take based on the information provided here are strictly at your own risk. You accept full responsibility for any decisions or outcomes arising from your use of this website and agree to release us from any liability in connection with your use of, or reliance upon, the content or products found herein.