
|
Porton Pharma Solutions Ltd. (300363.SZ) تقييم DCF |
Fully Editable: Tailor To Your Needs In Excel Or Sheets
Professional Design: Trusted, Industry-Standard Templates
Investor-Approved Valuation Models
MAC/PC Compatible, Fully Unlocked
No Expertise Is Needed; Easy To Follow
Porton Pharma Solutions Ltd. (300363.SZ) Bundle
تبحث لتقييم القيمة الجوهرية لـ Porton Pharma Solutions Ltd.؟ يدمج حاسبة DCF (300363SZ) بيانات العالم الحقيقي مع ميزات تخصيص واسعة ، مما يتيح لك تحسين تنبؤاتك وتعزيز قراراتك الاستثمارية.
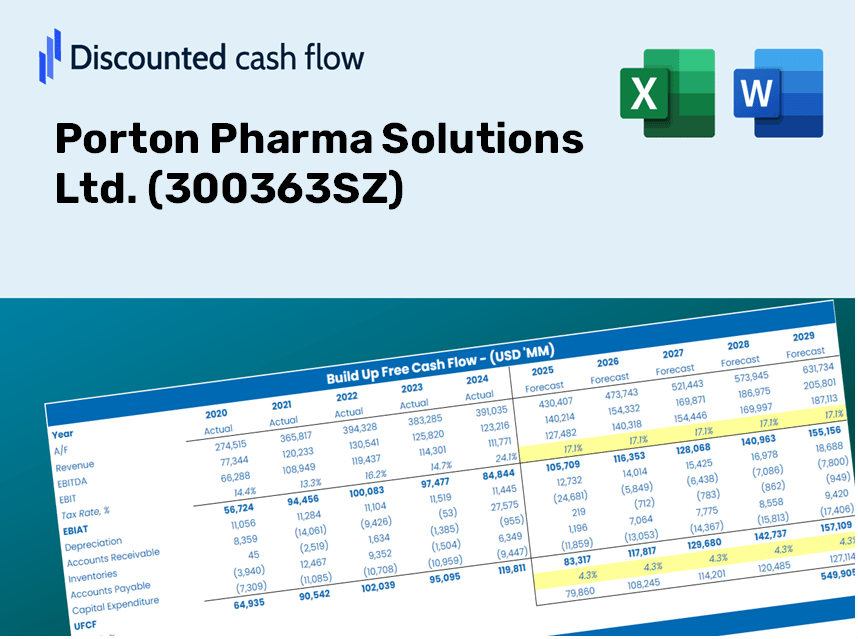
Discounted Cash Flow (DCF) - (USD MM)
| Year | AY1 2020 |
AY2 2021 |
AY3 2022 |
AY4 2023 |
AY5 2024 |
FY1 2025 |
FY2 2026 |
FY3 2027 |
FY4 2028 |
FY5 2029 |
|---|---|---|---|---|---|---|---|---|---|---|
| Revenue | 2,071.9 | 3,105.1 | 7,034.8 | 3,667.4 | 3,012.0 | 2,895.8 | 2,784.0 | 2,676.6 | 2,573.4 | 2,474.1 |
| Revenue Growth, % | 0 | 49.87 | 126.55 | -47.87 | -17.87 | -3.86 | -3.86 | -3.86 | -3.86 | -3.86 |
| EBITDA | 497.8 | 719.9 | 2,452.2 | 580.7 | 95.9 | 585.4 | 562.8 | 541.1 | 520.3 | 500.2 |
| EBITDA, % | 24.03 | 23.18 | 34.86 | 15.83 | 3.18 | 20.22 | 20.22 | 20.22 | 20.22 | 20.22 |
| Depreciation | 131.1 | 164.0 | 234.5 | 288.8 | 319.9 | 193.7 | 186.2 | 179.0 | 172.1 | 165.5 |
| Depreciation, % | 6.33 | 5.28 | 3.33 | 7.87 | 10.62 | 6.69 | 6.69 | 6.69 | 6.69 | 6.69 |
| EBIT | 366.7 | 555.9 | 2,217.6 | 291.9 | -224.0 | 391.8 | 376.7 | 362.1 | 348.2 | 334.7 |
| EBIT, % | 17.7 | 17.9 | 31.52 | 7.96 | -7.44 | 13.53 | 13.53 | 13.53 | 13.53 | 13.53 |
| Total Cash | 1,266.2 | 1,216.9 | 2,850.4 | 1,966.6 | 1,474.5 | 1,409.6 | 1,355.3 | 1,303.0 | 1,252.7 | 1,204.4 |
| Total Cash, percent | .0 | .0 | .0 | .0 | .0 | .0 | .0 | .0 | .0 | .0 |
| Account Receivables | 428.3 | 1,087.7 | 1,506.1 | 735.6 | 865.9 | 729.2 | 701.1 | 674.1 | 648.1 | 623.1 |
| Account Receivables, % | 20.67 | 35.03 | 21.41 | 20.06 | 28.75 | 25.18 | 25.18 | 25.18 | 25.18 | 25.18 |
| Inventories | 429.5 | 757.4 | 902.2 | 717.1 | 771.3 | 597.2 | 574.1 | 552.0 | 530.7 | 510.2 |
| Inventories, % | 20.73 | 24.39 | 12.82 | 19.55 | 25.61 | 20.62 | 20.62 | 20.62 | 20.62 | 20.62 |
| Accounts Payable | 512.6 | 1,111.1 | 1,787.9 | 796.1 | 899.3 | 796.4 | 765.6 | 736.1 | 707.7 | 680.4 |
| Accounts Payable, % | 24.74 | 35.78 | 25.42 | 21.71 | 29.86 | 27.5 | 27.5 | 27.5 | 27.5 | 27.5 |
| Capital Expenditure | -394.0 | -777.0 | -1,173.2 | -1,129.9 | -490.6 | -624.4 | -600.3 | -577.1 | -554.9 | -533.5 |
| Capital Expenditure, % | -19.02 | -25.02 | -16.68 | -30.81 | -16.29 | -21.56 | -21.56 | -21.56 | -21.56 | -21.56 |
| Tax Rate, % | 23.07 | 23.07 | 23.07 | 23.07 | 23.07 | 23.07 | 23.07 | 23.07 | 23.07 | 23.07 |
| EBITAT | 327.0 | 530.6 | 1,980.3 | 315.9 | -172.3 | 353.3 | 339.6 | 326.5 | 313.9 | 301.8 |
| Depreciation | ||||||||||
| Changes in Account Receivables | ||||||||||
| Changes in Inventories | ||||||||||
| Changes in Accounts Payable | ||||||||||
| Capital Expenditure | ||||||||||
| UFCF | -281.0 | -471.2 | 1,155.3 | -561.3 | -424.5 | 130.5 | -54.0 | -51.9 | -49.9 | -48.0 |
| WACC, % | 10.59 | 10.62 | 10.59 | 10.64 | 10.54 | 10.6 | 10.6 | 10.6 | 10.6 | 10.6 |
| PV UFCF | ||||||||||
| SUM PV UFCF | -26.9 | |||||||||
| Long Term Growth Rate, % | 2.00 | |||||||||
| Free cash flow (T + 1) | -49 | |||||||||
| Terminal Value | -569 | |||||||||
| Present Terminal Value | -344 | |||||||||
| Enterprise Value | -371 | |||||||||
| Net Debt | 96 | |||||||||
| Equity Value | -468 | |||||||||
| Diluted Shares Outstanding, MM | 543 | |||||||||
| Equity Value Per Share | -0.86 |
ماذا ستتلقى
- بيانات PPM الشاملة: يوفر كل من البيانات التاريخية والمتوقعة للتقييم الدقيق لـ Porton Pharma Solutions Ltd. (300363SZ).
- المعلمات القابلة للتخصيص: اضبط المتغيرات مثل WACC ، ومعدلات الضرائب ، ونمو الإيرادات ، والنفقات الرأسمالية لتناسب تحليلك.
- الحسابات الديناميكية: الحساب الفوري للقيمة الجوهرية و NPV لاتخاذ القرارات المستنيرة.
- نمذجة السيناريو: تقييم السيناريوهات المختلفة لتقييم التوقعات المستقبلية لـ Porton Pharma Solutions Ltd. (300363SZ).
- واجهة سهلة الاستخدام: تم تصميمه لخبراء الصناعة مع بقاء سهلة التنقل للقادمين الجدد.
الميزات الرئيسية
- 🔍 في الوقت الحقيقي Porton Pharma Financial: البيانات التاريخية والمتوقعة المليئة مسبقًا بـ Porton Pharma Solutions Ltd. (300363SZ).
- ✏️ مدخلات قابلة للتخصيص بالكامل: تعديل جميع المعلمات الأساسية (الخلايا الصفراء) مثل WACC و Growth ٪ ومعدلات الضرائب.
- 📊 تقييم DCF المهني: الصيغ المتكاملة حساب القيمة الجوهرية لـ Porton Pharma باستخدام نهج التدفق النقدي المخفض.
- ⚡ النتائج الفورية: عرض تقييم Porton Pharma فور إجراء التعديلات.
- تحليل السيناريو: تقييم ومقارنة نتائج السيناريوهات المالية المختلفة جنبًا إلى جنب.
كيف تعمل
- الخطوة 1: قم بتنزيل قالب Excel Prebuilt الذي يضم بيانات لـ Porton Pharma Solutions Ltd. (300363SZ).
- الخطوة 2: راجع الأوراق المملوءة مسبقًا للتعرف على المقاييس الأساسية.
- الخطوة 3: ضبط التوقعات والافتراضات في الخلايا الصفراء القابلة للتحرير (WACC ، النمو ، الهوامش).
- الخطوة 4: الوصول على الفور النتائج المحدثة ، بما في ذلك القيمة الجوهرية لـ Porton Pharma Solutions Ltd. (300363SZ).
- الخطوة 5: الاستفادة من النتائج لاتخاذ خيارات استثمار مستنيرة أو إنشاء تقارير شاملة.
لماذا تختار هذه الآلة الحاسبة؟
- بيانات موثوقة: استخدم Porton Pharma Solutions Ltd.
- خيارات مرنة: تخصيص المعلمات الأساسية مثل معدلات النمو و WACC ومعدلات الضرائب وفقًا لتوقعاتك.
- زيادة الكفاءة: توفر لك العمليات الحسابية المكوّنة مسبقًا الوقت والجهد من خلال إزالة الحاجة إلى البدء من الألف إلى الياء.
- أداة قياسية الصناعة: تم تصميمه للمستثمرين والمحللين والمستشارين الذين يركزون على Porton Pharma Solutions Ltd. (300363SZ).
- من السهل التنقل: التصميم سهل الاستخدام والتعليمات المباشرة تلبي المستخدمين من جميع مستويات الخبرة.
من يجب أن يستخدم هذا المنتج؟
- المستثمرون: تقييم بدقة القيمة العادلة Porton Pharma Solutions Ltd. (300363SZ) قبل اتخاذ خيارات الاستثمار.
- المدير المالي: الاستفادة من نموذج DCF من الدرجة الأولى لأغراض التقارير المالية والأغراض التحليلية.
- الاستشاريون: تخصيص القالب بفعالية لتقارير تقييم العميل.
- رواد الأعمال: اكتساب رؤى حول ممارسات النمذجة المالية التي تستخدمها الشركات الرائدة.
- المعلمون: توظيفها كمورد تعليمي لتوضيح تقنيات التقييم.
محتويات القالب
- البيانات المليئة مسبقا: ميزات Porton Pharma Solutions Ltd. الأداء المالي التاريخي والتوقعات.
- نموذج التدفق النقدي المخفض: نموذج تقييم DCF قابل للتحرير مجهز بالحسابات التلقائية.
- متوسط تكلفة رأس المال المرجح (WACC): ورقة عمل مخصصة لحسابات WACC ، مما يسمح للمدخلات المخصصة.
- النسب المالية الرئيسية: فحص ربحية Porton Pharma Solutions Ltd.
- مدخلات قابلة للتخصيص: بسهولة تعديل معدلات نمو الإيرادات والهوامش والافتراضات الضريبية.
- لوحة القيادة الصافية: الملخصات المرئية في المخططات والجداول التي تبرز نتائج التقييم الأساسية.
Disclaimer
All information, articles, and product details provided on this website are for general informational and educational purposes only. We do not claim any ownership over, nor do we intend to infringe upon, any trademarks, copyrights, logos, brand names, or other intellectual property mentioned or depicted on this site. Such intellectual property remains the property of its respective owners, and any references here are made solely for identification or informational purposes, without implying any affiliation, endorsement, or partnership.
We make no representations or warranties, express or implied, regarding the accuracy, completeness, or suitability of any content or products presented. Nothing on this website should be construed as legal, tax, investment, financial, medical, or other professional advice. In addition, no part of this site—including articles or product references—constitutes a solicitation, recommendation, endorsement, advertisement, or offer to buy or sell any securities, franchises, or other financial instruments, particularly in jurisdictions where such activity would be unlawful.
All content is of a general nature and may not address the specific circumstances of any individual or entity. It is not a substitute for professional advice or services. Any actions you take based on the information provided here are strictly at your own risk. You accept full responsibility for any decisions or outcomes arising from your use of this website and agree to release us from any liability in connection with your use of, or reliance upon, the content or products found herein.